


Investors face a special challenge with biotechnology stocks: Strong price fluctuations often arise due to regulatory decisions and clinical trial results. An analysis of over 13,000 studies makes it clear that small biotech companies in particular are highly sensitive to news from Phase 2/3 and Phase 3 studies. Positive results lead to price gains, negative outcomes usually trigger even stronger losses.
Event | Average Price Reaction |
|---|---|
Positive Phase 3 Results | |
Negative Phase 3 Results | Significantly more negative |
Despite these risks, innovation and technological progress constantly open up new opportunities. Those who use biotechnology stock risk indicators and modern market intelligence in a targeted manner can better assess fluctuations and make informed decisions.
Key Insights
Biotechnology stocks are highly volatile because study results and approvals have a major impact. Those who know these risk indicators can better assess when opportunities or risks arise.
Modern market intelligence with artificial intelligence and data analysis helps to quickly identify important information and make informed decisions. This allows risks to be managed early.
A long-term, data-driven strategy with continuous monitoring improves the chances of success. Patience and targeted analysis ensure sustainable growth in the dynamic biotech sector.
Overview
Biotechnology Sector
The biotechnology industry differs from other industries in many ways. It presents investors with unique challenges and opportunities. Key features include:
Long product development times: Companies often require many years to bring a product from research to market approval.
Strict and complex regulation: The sector is subject to globally fragmented and demanding regulatory requirements.
Shorter effective patent durations: Compared to other industries, the period in which companies benefit from patents is usually limited.
High competition intensity: Many companies compete for similar markets and innovations.
R&D as a core: Biotechnology companies invest a significant share of their revenue—often more than 16%—in research and development, driving innovation.
Despite these challenges, companies benefit from protection mechanisms such as patents, market exclusivity, and the ability to achieve premium prices. These factors can cushion risks and provide space for strategic growth.
Volatility
Volatility in the biotechnology sector remains exceptionally high. Price swings are often caused by regulatory decisions, clinical study results, or the low profitability of many companies. Net profit margins in the sector fluctuate about twice as much as in established industries like food. While operational risks are pronounced, total risks for investors can often be reduced by diversification. Nevertheless, investors do not receive above-average risk-adjusted returns despite the higher uncertainty. Those who understand the sector’s characteristics and dynamics can better assess opportunities and risks and strategically use market intelligence to make informed decisions.
Sources of Volatility

Regulatory Risks
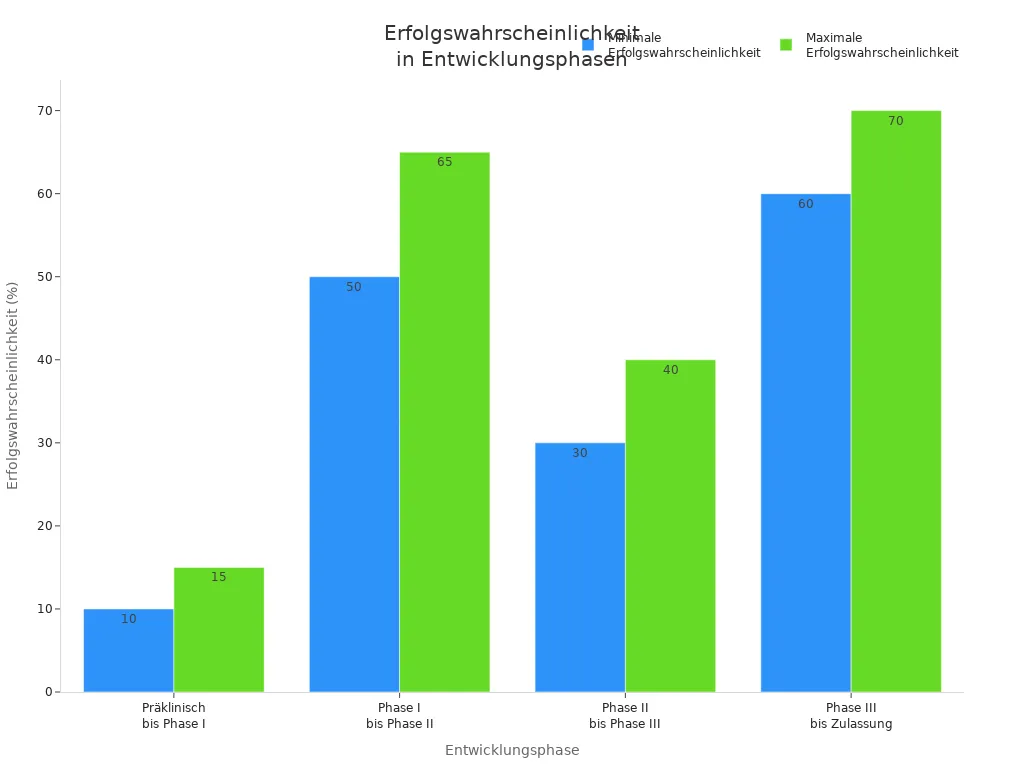
Regulatory decisions significantly shape the price development of biotechnology stocks. Companies often experience dramatic price movements when authorities such as the FDA approve or reject new drugs. Such events act as binary turning points: An approval can double a company’s market value overnight, while a rejection or delay can cause substantial losses. Studies from related sectors show that even an approval delay of a few months can reduce the expected lifetime sales of a product by up to 8%. The probability of success increases with each development phase, but remains low overall:
Development Phase | Probability of Success (%) |
|---|---|
Preclinical to Phase I | 10-15 |
Phase I to Phase II | 50-65 |
Phase II to Phase III | 30-40 |
Phase III to Approval | 60-70 |
Clinical Trials
Clinical trials are one of the greatest sources of uncertainty. Positive results can cause stock prices to jump, while negative results often trigger even stronger losses. Early-stage companies that are in preclinical or early clinical stages exhibit particularly high volatility. They generally do not generate revenue and rely on investor funds. Late-stage companies benefit from more stable cash flows and less volatility, but remain dependent on regulatory decisions.
A balanced mix of early and late development phases in a portfolio can help spread risks and seize opportunities.
Financing
The financial situation of a biotech company significantly affects price stability. Many firms lack steady income and are reliant on external capital. In times of restricted financing, volatility increases, as companies are forced to prioritize projects or form partnerships, often with a loss of control. Strong cash reserves boost investor confidence and can stabilize prices, while capital shortages lead to short-term price declines. Ultimately, the ability to react flexibly to market conditions determines a company’s resilience and growth potential.
Biotechnology Stock Risk Indicators

The selection and evaluation of biotechnology stock risk indicators forms the foundation for a sound analysis in the biotech sector. Investors and analysts use these indicators to better understand the uncertainties and opportunities of individual companies and to benchmark them against indices such as the NASDAQ Biotechnology Index. The main risk indicators can be grouped into four key categories: trial phases, approvals, financial status, and partnerships.
Trial Phases
Clinical trial phases are among the most significant biotechnology stock risk indicators. Each phase brings different probabilities of success or failure and decisively influences the valuation of a company. Progression through the phases has a direct effect on company value, since each successful transition increases the chance of market approval and lowers the risk.
Clinical Trial Phase | Avg. Price Increase (Positive Result) | Avg. Price Decrease (Negative Result) |
|---|---|---|
Phase 1 | approx. +3% | approx. -7% |
Phase 2 | approx. +12% | approx. -16% |
Phase 3 | approx. +11% | approx. -22% |
These figures show how sensitive stock prices are to study outcomes. Early-stage projects require high discount rates because the risk of failure remains high. With each successful phase, risk declines, reflected in higher valuations. Investors take into account success rates, completion rates, and average trial duration. The statistical significance of phase transitions is also shown by the fact that licensing deals and milestone payments are frequently tied to success in certain phases. Companies that progress from phase to phase successfully become more attractive and valuable.
Approvals
Regulatory approval is another central biotech stock risk indicator, determining whether a product can reach the market. Different regions such as the USA, EU, and Asia-Pacific set varying regulatory standards and offer different accelerated approval routes.
Region | Growth (CAGR) | Remarks | |
|---|---|---|---|
APAC | >50% | 14% | Largest share, regulatory reforms in China speed approvals |
USA | 29% | Marginal | Consistent activity, established accelerated pathways |
EU5 | 17% | Negative | Slower growth, structured fast-track programs |
The USA offers several accelerated approval programs such as Priority Review and Breakthrough Therapy, while the EU sets stricter criteria for orphan drugs. In Asia, regulatory reforms—especially in China—have considerably sped up approvals. These differences affect not only the speed but also the likelihood of successful market entry. For investors, it means they must closely monitor the regulatory frameworks and approval probabilities in each market to realistically assess risks and opportunities.
Financial Status
The financial status of a biotech company is one of the most important risk indicators. Companies without steady revenue rely on external financing, which increases volatility. The ability to raise capital and respond flexibly to market conditions determines a company’s resilience.
A strong financial position signals stability to investors and increases the likelihood that a company can advance clinical programs to market readiness. Weak cash balances or high burn rates, on the other hand, increase the risk of dilution or project cancellations.
Analysts use methods such as Monte Carlo simulations and risk-adjusted net present value (rNPV) calculations to model various future scenarios. These quantitative approaches help to represent uncertainties in drug development and launch and to better understand a company’s risk-return profile. The NASDAQ Biotechnology Index serves as a benchmark for assessing the risk-adjusted performance of individual companies within the industry. Metrics such as the Sharpe Ratio or Sortino Ratio allow comparison of returns relative to the risks taken.
Partnerships
Strategic partnerships and alliances have a major influence on the risk and return profile of biotech companies. Collaborations with large pharmaceutical companies, academic institutions, or other biotechs enable access to resources, expertise, and markets that a single company could rarely achieve alone.
The development of the COVID-19 vaccine by BioNTech and Pfizer demonstrates how close partnerships can accelerate the planning and execution of clinical trials and reduce the risk of failure.
Historical data show that returns from alliances in the biotech sector are significantly higher than from classic mergers and acquisitions. By pooling resources and involving all stakeholders early, delays and inefficiencies can be minimized. At the same time, partnerships bring operational and tax challenges that require proactive management. Overall, strategic partnerships improve the risk-return profile by both increasing upside potential and making risks more manageable through cooperation and innovation.
The combination of these biotechnology stock risk indicators allows investors to navigate sector complexity and make informed decisions. Those who understand the dynamics of trial phases, approval processes, financial status, and partnerships can better seize opportunities and manage risks. The NASDAQ Biotechnology Index is a valuable benchmark for reflecting your own risk position in the sector.
Market Intelligence
Modern market intelligence forms the backbone of effective risk management in the biotechnology sector. Today, companies and investors face the challenge of capturing, analyzing, and turning vast amounts of data from diverse sources into actionable insights. Traditional methods are no longer sufficient to handle the complexity and dynamics of the sector. New technologies like artificial intelligence, big data, and sentiment analysis open innovative paths to detect risks early and systematically leverage opportunities.
Data Analysis
Effective data analysis is crucial for success in identifying risk factors in biotechnology investments. The breadth and depth of available information require specialized techniques that go far beyond traditional evaluations. The most effective methods include:
Generative AI (genAI): Automates research, speeds up evaluation, and increases accuracy, especially when trained on financial data.
Semantic Search: This technique enables searching not only for exact terms, but also for synonyms and related concepts. This creates a broader information base that reveals hidden risks.
Real-time Monitoring: Automated alerts on market trends and company news help detect risks instantly and react quickly.
Sentiment Analysis: By evaluating sentiment in financial documents and news, analysts gain deep insights into market opinion and potential risks.
Data Export and Integration: The ability to export data into your own models supports individual, in-depth risk analysis.
These methods make it possible to systematically capture biotechnology stock risk indicators and match them with current market developments. They provide a solid basis for data-driven decisions and strengthen resilience against sudden market events.
AI & Big Data
Artificial intelligence and big data are revolutionizing risk assessment in the biotech sector. AI models analyze not only clinical trial announcements but also process a variety of data types—from stock price time series to network relationships between companies and diseases. Machine learning is especially strong at predicting extreme negative market events, which is central for risk management. The integration of sentiment analysis, time-series models, and network data significantly increases predictive power. Studies show such models achieve a weighted ROC AUC of over 0.7 for various market reactions—a value that challenges the assumption of efficient markets.
Big data plays a key role by bringing together vast and varied data sources. Platforms such as BiopharmaWatch aggregate critical metrics from hundreds of companies, including clinical trials, regulatory events, and market movements. This data-driven approach makes it possible to precisely identify and quantify risks. Investors thus receive timely, comprehensive, and objective information on development stages, approval probabilities, and financial indicators.
However, experience shows that the quality and fairness of data are crucial. Distorted or incomplete datasets can lead to faulty risk assessments. An algorithm based on incomplete data may assess identical situations differently—with potentially serious consequences for investment decisions.
Despite all advances, current market intelligence tools have their limits. Long development cycles, complex regulatory requirements, and high failure rates in clinical trials make complete risk assessment difficult. AI models cannot always represent biological complexity, and ethical challenges like data privacy and biases in decision processes remain. The integration of AI should therefore be seen as a supplement to traditional methods, not as a replacement.
Sentiment
The analysis of market sentiment has become an indispensable tool for controlling short-term volatility. Sentiment analysis tools capture the mood in news, social media posts, and corporate communications. Platforms like Twitter spread financial information in real time and enable investors to respond quickly to new developments.
Tweets about news, company and CEO opinions, and competitor opinions are directly related to the price performance of biotechnology stocks.
The combination of historical market data with social media data, such as for COVID-19 and vaccines, improves prediction accuracy.
Sentiment scores, determined by tools like VADER, are incorporated into statistical models to improve stock price forecasting power.
Negative sentiment has a stronger effect on prices than positive sentiment, since critical discussions go viral and automated trading algorithms trigger rapid responses.
Examples such as COVID-19 vaccine announcements show how social media discussions can lead to sudden and significant price jumps.
Integrating sentiment data into the analysis of biotechnology stock risk indicators allows not only fundamental but also psychological market factors to be considered. This makes it easier to manage short-term risks and spot opportunities early.
Despite enormous progress, the lack of truly comprehensive tools remains a challenge. The sector’s complexity, long development cycles, regulatory uncertainties, and ethical issues require ongoing improvement of market intelligence tools. However, those who strategically combine modern data analysis, AI, and sentiment analysis gain a decisive knowledge advantage and can assess risks in the biotech sector much more effectively.
Practical Examples
Study Results
In practice, market intelligence and biotechnology stock risk indicators work closely together to actively manage price fluctuations. During the COVID-19 pandemic, analysts paid special attention to the progress of Pfizer and Moderna. Companies that consistently pursued innovation and research gained increased investor trust. At the same time, targeted political measures and monitoring of investor sentiment helped reduce uncertainty and volatility. The reaction to clinical study results has changed in recent years. Investors today react more selectively and no longer reward every positive news with price gains. They prefer companies with validated scientific approaches, clear patient benefits, and well-considered regulatory strategies. Case studies such as Stealth BioTherapeutics and UroGen Pharma show how regulatory setbacks can lead to heavy price losses. Early monitoring of regulatory risks helps recognize such developments and adjust portfolios accordingly.
News Tracking
Real-time news tracking has become an essential tool in risk management. Investors detect risks like regulatory changes, controversies, or ESG-related developments at an early stage by continuously tracking news. Automated filters allow efficient collection of relevant information and enable quick responses to new challenges. This approach not only supports alignment with sustainable investment principles but also helps avoid greenwashing. By constantly updating the information base, investors can make their portfolios more resilient and promote long-term stability. Combining real-time data and biotechnology stock risk indicators creates a solid foundation for strategic decisions and increases adaptability in a dynamic market environment.
Recommendations
Strategy
A successful investment strategy in the biotechnology sector is based on the targeted integration of biotechnology stock risk indicators and modern market intelligence. Investors who systematically monitor key metrics such as R&D spending, patent applications, time-to-market, and clinical trial success rates gain a crucial knowledge advantage. They align innovation metrics with financial and strategic planning to optimally adapt investments to market needs and future trends. Analysis and innovation management software supports the effective management of these indicators. Practice shows that companies like Amgen have shortened their time-to-market and increased the success rate of clinical trials through targeted KPI selection and continuous adjustment.
Long-term thinking pays off: Historical data show that biotech portfolios have outperformed the overall market over decades. Innovations such as mRNA vaccines or gene editing not only change medicine, but also the economic environment. Industry experts emphasize that patience and a long-term investment horizon are essential to benefit from breakthrough developments.
Monitoring
Continuous monitoring is the backbone of effective risk management. Companies that continuously monitor risk indicators can dynamically assess risks and respond early to changes. Real-time data and AI-powered analyses make it possible to recognize warning signals and take proactive measures. Setting up key risk indicators (KRIs) and communicating them transparently strengthen the confidence of investors and stakeholders. Regular reporting and flexible resource allocation secure competitiveness and support sustainable returns. This approach improves the ability to respond to regulatory and market changes and to make well-founded investment decisions.
Those who consistently integrate biotechnology stock risk indicators and market intelligence into their strategy lay the foundation for sustainable success and remain able to act even in volatile times.
The most important findings can be summarized as follows:
Biotechnology stocks require differentiated risk indicators since classical valuation methods are often insufficient.
Market intelligence tools allow early risk detection and targeted opportunity assessment.
Data-driven strategies, AI and predictive analytics are shaping the future of the sector.
Those who use modern analytics remain adaptable in the dynamic biotechnology market and can identify potential early.
FAQ
How do risk indicators in the biotech sector differ from other industries?
Biotechnology risk indicators consider clinical trial phases, regulatory milestones, and partnerships. Other industries focus more on revenue, market share, and operational metrics.
What role does artificial intelligence play in assessing risks for biotech stocks?
Artificial intelligence analyzes large data sets, identifies patterns, and helps investors spot risks early. It improves predictive power and supports data-driven decisions.
Why is long-term monitoring so important in the biotech sector?
Long-term monitoring makes it possible to recognize trends, regulatory changes, and innovations in time. Companies adapt their strategies and thus secure sustainable growth and stability.
Gaining Clarity in a Complex Market
The path to sustainable success means much more than chasing quick trends—especially in dynamic fields like biotechnology. Precisely because breakthrough innovation and pronounced fluctuations go hand in hand, the sector demands a clear look beyond the headlines and a deeper understanding of the factors that really drive market movements. At VASRO, we see sustainable success as a journey shaped by thoughtful analysis—where precise data and modern market intelligence together make opportunities visible and highlight the many nuances of risks. Those who observe how markets respond to clinical milestones or regulatory changes quickly recognize: It is insight, curiosity, and continuous learning that help meet uncertainties and enable long-term growth. In a world where information is available everywhere, the difference is made by those who gain real perspective from data and navigate even complex sectors with calm and overview.
Disclaimer: The information provided on www.vasro.de is for general informational purposes only and does not constitute investment advice or a recommendation to invest in any particular asset or market. VASRO GmbH does not offer personalized investment advice, and the content on this website should not be relied upon as such. Visitors are encouraged to seek independent financial advice tailored to their specific circumstances before making any investment decisions. VASRO GmbH disclaims any liability for investment decisions made based on the information presented on this website.