


When you conduct a deep dive equity report, you engage in deep dives that combine both quantitative and qualitative research. You start your process by gathering public filings, analyzing financial metrics, and exploring industry insights. In deep dives, you look beyond numbers to understand business models, leadership, and market context. Deep dive work demands that you scrutinize companies i am curious about, assess financial health, and synthesize findings. Each process step should transform thorough research into actionable investment recommendations.
Thoughtful deep dives reveal not just what a company is, but what it could become.
Table of Contents
Key Takeaways
Start your deep dive by setting clear goals and defining the scope to guide thorough research and deliver useful investment insights.
Gather both quantitative data like financial metrics and qualitative information such as management quality to get a full picture of the company.
Analyze financial statements carefully, focusing on income, balance sheet, cash flow, and key ratios to understand company health and risks.
Use valuation methods like Discounted Cash Flow and comparables to estimate a company’s true worth and support your investment decisions.
Summarize your findings clearly, combining analysis and risks into a strong investment recommendation that guides confident action.
Objectives
Purpose
When you embark on a deep dive equity report, you set out to achieve more than just a surface-level understanding. Your primary goal is to create a comprehensive analysis that supports informed investment decisions. In institutional settings, you deliver value by providing clarity, transparency, and a structured presentation that builds trust. You tailor your research process to meet the complex requirements of institutional investors, ensuring that your findings align with their long-term strategies and portfolio management needs.
A well-executed research process does not just highlight numbers—it uncovers the story behind the data, revealing both risks and opportunities.
You will find that the purpose of your report shifts depending on your audience. Buy-side analysts use the research process to guide internal investment decisions and maximize returns, while sell-side analysts focus on generating interest and facilitating transactions. Both approaches require you to synthesize financial analysis, peer comparisons, and actionable recommendations. Your process should always aim to transform raw data into insights that drive strategic action.
Key objectives of a deep dive equity report include:
Delivering detailed financial analysis and risk assessments.
Benchmarking performance against peers.
Customizing the report to fit the needs of sophisticated investors.
Supporting long-term investment strategies with tailored insights.
Scope
You define the scope of your deep dive equity report by the depth and breadth of your research process. A thorough report examines every aspect of a company’s financial health, from revenue sources and cost structures to accounting practices and internal controls. You analyze all major financial statements, ensuring that your process captures both the big picture and the fine details.
The research process often spans several weeks or even months, especially for complex businesses or high-risk industries.
You adapt your process to the quality of available data and the specific requirements of your client.
Your research covers not only quantitative metrics but also qualitative factors such as management quality and industry context.
By setting clear objectives and defining a robust scope, you ensure that your research process delivers actionable, reliable insights that empower decision-makers.
Data Collection
When you begin deep dives into companies, you start by gathering a wide range of information. The research process demands that you look at both numbers and narratives, ensuring you capture every angle that matters to an investor. You want your deep dive to stand on a foundation of reliable data, so you use a mix of public filings, financial metrics, and qualitative insights.
Public Filings
You rely on public filings as the backbone of your research. These documents—such as 10-K and 10-Q reports, earnings transcripts, and investor presentations—offer a transparent view into companies’ operations. You also examine industry data to understand the broader context. By reviewing these sources, you gain a clear sense of how companies report their performance, manage risks, and communicate with stakeholders. Deep dives require you to read between the lines, spotting trends and red flags that might not appear in headline numbers.
Financial Metrics
You analyze financial metrics to measure the health and efficiency of companies. In your research process, you focus on several critical areas:
Operational metrics, like inventory turnover and operating margin, show how well companies run their daily business.
Liquidity metrics, such as current and quick ratios, reveal how companies handle short-term obligations.
Profitability metrics, including net profit margin, return on assets, and return on equity, help you assess earnings power.
Leverage metrics, like debt-to-equity ratio, indicate how much companies rely on borrowed funds.
You also look at customer retention, revenue growth, and capital efficiency. These metrics help you understand growth dynamics and how companies use capital as they scale. Deep dives into these numbers reveal patterns that drive your investment thesis.
Qualitative Insights
Numbers alone never tell the full story. You gather qualitative insights by reviewing governance documents, sustainability surveys, and executive compensation reports. You might conduct interviews or site visits to assess management quality and company culture. External sources, such as stakeholder feedback and media reports, add depth to your research. By integrating these insights, you create a more complete picture of companies’ leadership, ethics, and ESG practices. Deep dives that blend quantitative and qualitative research give you the confidence to make informed recommendations.
The most effective research process combines hard data with human judgment, allowing you to see both the strengths and the subtleties that define companies.
Company Overview
A well-structured company overview gives you a clear foundation for deeper analysis. You want to understand how companies operate, who leads them, and the environment in which they compete. This section sets the stage for your financial and strategic evaluation.
Section | |
|---|---|
Company Description | Business model, strategy, key charts and figures |
Industry Overview and Competitive Positioning | Industry metrics, competitive landscape, external influences, industry position, strategy |
Management Overview | Management composition and quality |
Business Model
You begin by examining the business model, which reveals how companies create, deliver, and capture value. The structure of a business model shapes long-term financial performance. For example, asset-light models allow companies to focus on core strengths and adapt quickly to market changes. Some companies embed social impact into their operations, which can enhance sustainability and stakeholder trust. When you analyze business models, you look for features that drive growth, resilience, and competitive advantage. Understanding these elements helps you anticipate how companies might perform over time.
Management
Management quality often determines whether companies succeed or struggle. You assess the leadership team’s experience, track record, and strategic vision. Direct interactions with executives can provide insights beyond what public documents reveal. Strong management teams set clear goals, respond effectively to challenges, and foster a culture of accountability. You also consider governance structures and incentive systems, which influence decision-making and risk management. By evaluating management, you gauge the likelihood that companies will execute their strategies successfully.
Industry Context
Industry context frames the opportunities and risks that companies face. You analyze industry trends, competitive dynamics, and regulatory factors. Companies that understand their market position can adapt to external pressures and seize emerging opportunities. You compare companies against peers to identify strengths and weaknesses. Industry research highlights how digitization, customer preferences, and capital needs shape business strategies. By placing companies within their broader environment, you gain a holistic view that informs your investment perspective.
A thoughtful company overview connects the dots between business model, leadership, and industry context, giving you the clarity to move forward with confidence.
Financial Analysis
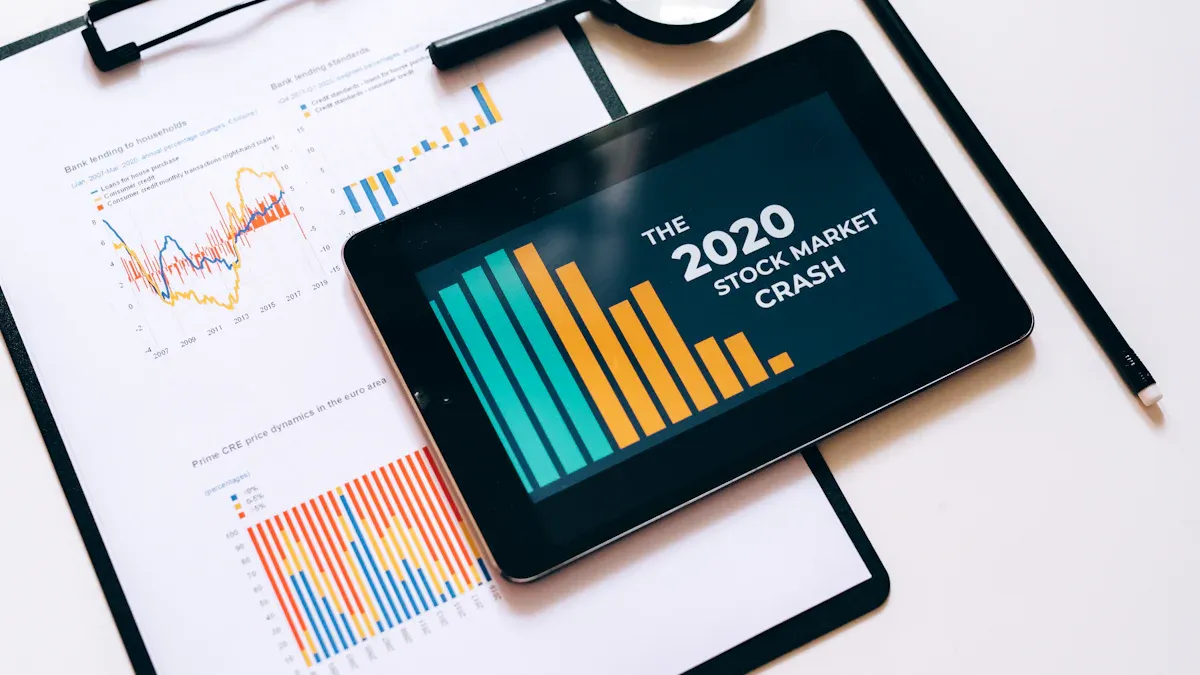
A deep dive equity report stands on the strength of your financial analysis. This section transforms raw numbers into a narrative that reveals a company’s true performance, resilience, and potential. You will examine the income statement, balance sheet, cash flow, and key ratios, weaving together a holistic view that supports sound investment judgment.
Income Statement
You begin your analysis with the income statement, the financial document that tells the story of a company’s profitability over time. Each line item offers a clue about operational efficiency, cost discipline, and growth momentum. To unlock these insights, focus on the most important components:
Sales Revenue: This figure marks the starting point for all projections. It reflects the company’s ability to generate demand and capture market share.
Cost of Goods Sold (COGS): Direct costs tied to sales reveal how efficiently the company manages production or service delivery.
General Expenses (SG&A): These operating expenses, excluding COGS, highlight the cost of running the business day-to-day.
Depreciation Expense: This non-cash charge shows how the company allocates the cost of long-term assets over time.
Interest Expense: The cost of debt financing signals the company’s leverage and risk appetite.
Tax Expense: Taxes on income affect the bottom line and can indicate the effectiveness of tax planning.
By analyzing these line items, you calculate net income—the ultimate measure of profitability for equity valuation. You can use vertical analysis to express each item as a percentage of sales, which helps you compare cost structures across companies or industries. Horizontal analysis, on the other hand, tracks changes over multiple periods, revealing trends in revenue growth, margin expansion, or cost control. Both approaches help you uncover the drivers behind profitability and identify patterns that may shape future performance.
When you read an income statement with a critical eye, you see more than numbers. You see the company’s ability to adapt, innovate, and thrive in changing markets.
Balance Sheet
The balance sheet provides a snapshot of a company’s financial position at a specific point in time. It details what the company owns, what it owes, and the equity that remains for shareholders. You must look beyond the totals and examine how the structure of assets and liabilities shapes the company’s risk profile.
Changes in asset composition, such as a shift toward long-term or mortgage-related assets, can increase exposure to interest rate risk.
Moving from fixed-rate to adjustable-rate products may reduce some risks but introduce new sensitivities.
A greater reliance on short-term, rate-sensitive funding sources can make the company more vulnerable to rising interest costs.
Embedded options in liabilities, like callable or convertible debt, add complexity and potential risk in volatile markets.
The balance sheet also reflects the company’s capacity to take on risk and respond to regulatory or monetary policy changes. Regulatory requirements, such as capital adequacy and liquidity ratios, set boundaries for risk-taking and influence the size and composition of the balance sheet. Effective risk management—through asset mix adjustments, dynamic modeling, and proactive planning—can help the company sustain earnings and weather economic shifts.
A well-structured balance sheet is not just a record of assets and liabilities. It is a blueprint for resilience, adaptability, and long-term value creation.
Cash Flow
Cash flow analysis reveals the lifeblood of any business: its ability to generate and manage cash. You want to know not just how much profit a company reports, but how much cash it actually produces and where that cash goes.
Metrics like Free Cash Flow (FCF) and cash-based economic profit measures, such as CSX Cash Earnings (CCE), have shown a strong correlation with stock price appreciation. These metrics adjust operating income by adding back non-cash charges like depreciation and subtracting taxes and capital charges. They help you assess whether the company’s investments are generating returns above expectations and encourage disciplined capital allocation.
You should also pay close attention to operating profit growth. Studies have found that growth in operating profit, even more than some traditional cash flow metrics, often aligns closely with share price appreciation. This underscores the importance of profitability from core operations in driving long-term value.
When you follow the flow of cash, you gain insight into a company’s discipline, agility, and capacity for growth.
Key Ratios
Financial ratios distill complex data into clear signals about a company’s health, efficiency, and valuation. Some ratios stand out for their predictive power and relevance to equity analysis.
The Cyclically-Adjusted Price-to-Earnings (CAPE) Ratio offers strong long-term insight into future equity returns, especially when combined with business cycle indicators like term and credit spreads.
Dividend Yield (DY), Book-to-Market (B/M), and Earnings-Price (E/P) ratios also provide valuable clues about future returns, as they measure stock prices relative to underlying fundamentals.
These ratios work through mean reversion, helping you spot when a company or market may be undervalued or overvalued.
You should use these ratios alongside traditional measures such as return on equity, debt-to-equity, and current ratio. This approach gives you a comprehensive view of profitability, leverage, liquidity, and valuation.
Ratio Name | What It Shows | Why It Matters |
|---|---|---|
CAPE Ratio | Price vs. long-term earnings | Predicts long-term equity returns |
Dividend Yield | Dividends per share vs. price | Indicates income potential and value |
Book-to-Market | Book value vs. market value | Highlights undervalued or overvalued stocks |
Earnings-Price | Earnings per share vs. price | Assesses profitability relative to price |
Return on Equity | Net income vs. shareholder equity | Measures efficiency in generating returns |
Debt-to-Equity | Debt vs. equity | Evaluates financial leverage and risk |
Current Ratio | Current assets vs. current liabilities | Gauges short-term liquidity and stability |
Ratios are not just numbers. They are signals—if you know how to listen.
A thoughtful financial analysis does more than check boxes. It uncovers the patterns, strengths, and vulnerabilities that define a company’s future. When you combine rigorous analysis with a curious mindset, you gain the clarity to see not just where a company stands, but where it could go next.
Valuation
Valuation stands at the heart of every deep dive equity report. You use it to translate your research and analysis into a clear estimate of what a company is truly worth. The most respected approaches in equity research include Discounted Cash Flow (DCF) analysis, Comparable Company Analysis, and the determination of a target price. Each method brings its own strengths and nuances, helping you see value from multiple perspectives.
DCF Method
When you apply the DCF method, you project a company’s future free cash flows over a set period—often five to ten years. You then estimate a terminal value to capture the business’s worth beyond the forecast horizon. To bring these future cash flows into today’s terms, you discount them using a rate that reflects the company’s risk profile, typically the Weighted Average Cost of Capital (WACC). Summing the present values of all forecasted cash flows and the terminal value gives you the firm’s intrinsic value. Dividing this figure by the number of shares outstanding yields the intrinsic share price. This approach demands careful attention to assumptions about growth, margins, and discount rates, as even small changes can shift your valuation meaningfully.
Tip: Use tools like Excel or specialized software to streamline your DCF calculations and test different scenarios.
Comparables
Comparable Company Analysis offers a practical way to benchmark a company’s value against its peers. You select public companies with similar industry classification, size, geographic presence, business model, and financial metrics. By analyzing valuation multiples such as EV/EBITDA, P/E, and P/B, you estimate what the market might pay for your target company. Adjustments for differences in growth, capital structure, or business model ensure your comparison remains fair and relevant. This method helps you anchor your valuation in current market realities.
Key criteria for selecting comparables:
Industry and sector alignment
Similar size and market capitalization
Geographic proximity
Comparable business models and financial profiles
Target Price
You synthesize your valuation work by setting a target price. Many analysts blend DCF results with multiples-based estimates, balancing intrinsic value with market sentiment. In practice, you might multiply expected earnings per share by an appropriate P/E ratio or average target prices from several analysts to arrive at a consensus. This target price serves as a reference point, guiding your investment thesis and helping you communicate your view with clarity.
Remember: A target price is an informed projection, not a guarantee. It reflects your best judgment, shaped by rigorous analysis and thoughtful scenario planning.
Valuation is both art and science. By combining robust models with real-world context, you gain a deeper understanding of what drives value—and how to spot opportunity where others may not look.
Risk Factors
Understanding risk factors gives you a sharper lens for evaluating any company’s true resilience. By examining business, financial, and market risks, you can anticipate challenges that may impact performance and valuation. This approach helps you build a more robust investment thesis and prepares you to respond thoughtfully to uncertainty.
Business Risks
Business risks often arise from both internal operations and external events. You need to consider a wide spectrum of threats, from cyber incidents to regulatory changes. The table below highlights the most common business risks identified in recent equity research:
Rank | Business Risk | Description and Context |
|---|---|---|
1 | Cyber incidents | Ransomware, data breaches, and IT outages top the list for 2025. |
2 | Business interruption | Supply chain disruptions remain a persistent concern post-pandemic. |
3 | Natural catastrophes | Floods and storms continue to cause high insured losses. |
4 | Changes in legislation and regulation | New rules on sustainability, crypto, and AI create compliance challenges. |
5 | Climate change | Extreme weather events disrupt operations and damage assets. |
6 | Fire, explosion | These events can halt production and cause significant losses. |
7 | Macroeconomic developments | Shifts in government policy and economic cycles affect growth prospects. |
8 | Market developments | Tariffs and shifting trends influence mergers and acquisitions. |
9 | Political risks and violence | Civil unrest and instability can threaten business continuity. |
10 | Rapid advances, especially in AI, increase complexity and vulnerability. |
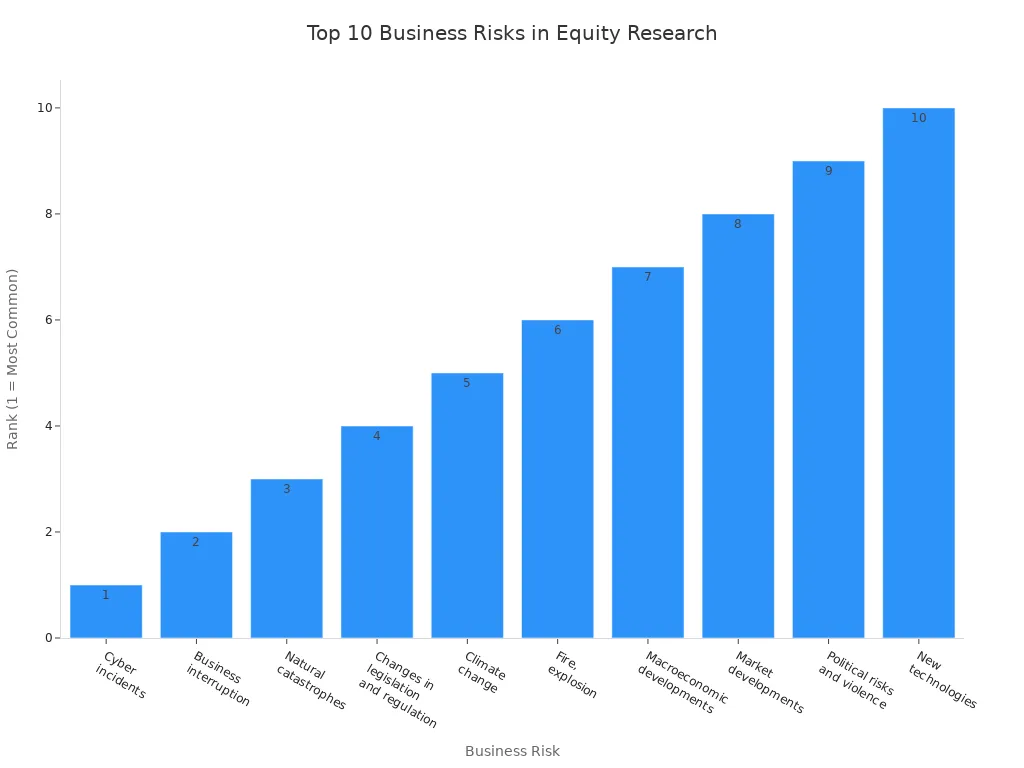
You gain a strategic edge when you recognize how these risks can disrupt operations, supply chains, or even entire industries.
Financial Risks
Financial risks shape how you interpret a company’s stability and future prospects. Leverage acts as a double-edged sword: when a company’s return on assets exceeds its cost of debt, leverage boosts returns for shareholders. If asset returns fall short, leverage magnifies losses, increasing risk. Liquidity risk also plays a critical role. Transaction liquidity risk can lead to adverse price movements when buying or selling assets, while funding liquidity risk emerges if a company’s credit position deteriorates. These risks often interact—high leverage can worsen the effects of liquidity shortages, sometimes forcing asset sales that depress prices and threaten solvency. Global liquidity conditions further influence leverage cycles, with debt levels rising in good times and amplifying stress during downturns. By understanding these dynamics, you can better assess a company’s financial resilience.
Market Risks
Market risks reflect the broader forces that can unsettle even the strongest companies. You should pay close attention to:
Liquidity risk, including sudden shocks and reduced market-making activity.
Counterparty risk, especially when exposures and default risks move together.
Systemic risk, which arises from the interconnectedness of financial institutions.
Uncertainty, as shifts in economic outlook can quickly alter market sentiment.
Volatility, often amplified by leverage and rapid trading.
Regulatory changes, such as new rules that affect liquidity and trading costs.
Shifting hedge fund exposures, which can impact asset prices and yield curves.
The rising correlation among stock returns, which can reduce diversification benefits.
By mapping these risks, you prepare yourself to navigate volatility and make more informed, forward-looking decisions.
A thoughtful risk assessment does more than identify threats—it helps you see where adaptability and strategic planning can turn risk into opportunity.
Growth Potential

Market Trends
You operate in a landscape shaped by powerful market trends that redefine how companies grow and compete. Digital transformation and automation now enable you to streamline operations, reduce costs, and boost productivity. Personalization and AI-driven tools elevate the customer experience, fostering loyalty and satisfaction. Companies that diversify their products and services can explore new markets and unlock additional revenue streams. Strategic partnerships expand your reach and capabilities, opening doors to innovation and new audiences. Sustainability and corporate social responsibility attract environmentally conscious customers, building brand loyalty and trust.
Digital transformation and automation
Enhanced customer experience through AI and personalization
Product and service diversification
Strategic partnerships and alliances
Sustainability and social responsibility
You also see the rise of AI-enabled business models, blending digital and physical touchpoints for seamless experiences. AI now optimizes pricing, inventory, and promotions, while also driving smarter M&A strategies and portfolio decisions. Responsible AI deployment and human-AI collaboration balance innovation with trust and safety. In retail, trends like BOPIS (Buy Online, Pick Up In Store), ‘store within a store’ formats, and the expansion of healthcare services create new growth avenues. The emergence of the metaverse offers fresh platforms for consumer engagement and virtual experiences.
Strategy
A well-defined strategy forms the backbone of sustainable growth. You increase your chances of achieving project goals when you develop structured action plans. Companies that set clear, measurable objectives—such as boosting sales by a specific percentage within a set timeframe—position themselves to track progress and adapt quickly. You identify key performance indicators, allocate resources wisely, and establish timelines with milestones to maintain momentum. Regular reviews and adjustments keep your strategy flexible and responsive to changing market conditions.
Define clear, measurable objectives
Identify and track key performance indicators
Allocate resources to priority initiatives
Set timelines and milestones
Review and adjust plans regularly
This disciplined approach helps you anticipate challenges, measure progress, and align your actions with industry growth projections.
Innovation
Innovation sets you apart in a crowded marketplace. By offering unique value propositions and adapting to change, you create lasting differentiation. You see innovation not only in new products or services but also in technology adoption, pricing, communications, and client experience management. Even in risk-averse sectors, innovation has become essential for survival and growth. You might leverage collaborative workshops, design thinking, or human-centered design to balance creativity with operational feasibility. Innovation allows you to respond to emerging client needs, improve service delivery, and build stronger relationships.
Unique value propositions and adaptability
New service development and technology adoption
Creative approaches to client experience
Design thinking and human-centered design
Balancing creativity with operational realities
When you embrace innovation, you foster growth, improve morale, and gain a competitive edge. The most resilient companies view change as an opportunity, not a threat, and continually seek new ways to create value.
Synthesize Findings
Deep Dive Equity Report Summary
When you reach the synthesis stage of your deep dive equity report, you bring together every insight, data point, and observation into a clear, actionable narrative. This summary acts as the heart of your investment memo, distilling complex research into a format that decision-makers can quickly grasp. You want your summary to highlight not only what you discovered, but also why it matters for the investment opportunity at hand.
A well-structured summary typically includes several core elements. The table below outlines these components, showing how each one contributes to a comprehensive investment memo:
Common Element | Description | Example from ‘TechHaven Inc.’ Summary |
|---|---|---|
Executive Summary | Concise overview capturing key findings, recommendations, and investment arguments for quick understanding. | “TechHaven Inc. is rated Buy with a 12-month price target of $42. Growing demand for cloud-based services…” |
Company Overview & Industry Context | Introduces the company, business model, market position, and industry dynamics influencing performance. | “Founded in 2010, TechHaven Inc. develops cybersecurity solutions for SMEs, operating in North America and Europe…” |
Financial Analysis & Key Metrics | Detailed examination of revenue growth, profitability, cash flow, and balance sheet trends, often with charts. | “In Q1, revenue grew 18% YoY to $220 million; operating margin expanded to 24% from 19% due to licensing fees…” |
Valuation Methods Used | Explanation of valuation models applied (e.g., DCF, P/E), with rationale behind chosen methods. | “Using a discounted cash flow model, intrinsic value estimated at $41 per share; forward P/E at 18x vs. peer average 22x.” |
Investment Thesis | Core argument for buy/hold/sell decision, integrating financial and qualitative insights. | “Expect increased cybersecurity spending and AI-driven firewall release to drive double-digit growth.” |
Catalysts and Risk Factors | Identification of upcoming events that could impact stock price and potential risks to investment returns. | “Risks include competitive pressure, slower product adoption, and economic downturns affecting software spending.” |
Analyst Rating and Price Target | Final recommendation and price target based on analysis, setting expectations for stock performance. | “Rated Buy with a 12-month price target of $42.” |
You should use this structure as a checklist when preparing your own deep dive equity report. Start with a concise executive summary that captures the essence of your findings. Introduce the company and its industry context, then move into a focused discussion of financial performance and valuation. Clearly state your investment thesis, highlighting both the upside catalysts and the risks that could affect the investment opportunity. Conclude with your analyst rating and a well-supported price target.
Tip: A strong investment memo does not just summarize data—it tells a story that connects the company’s fundamentals to its future potential.
Investment Recommendation
Your investment recommendation is where you transform analysis into action. This section of the deep dive equity report serves as the bridge between research and decision-making. You must synthesize all your findings, weighing both quantitative forecasts and qualitative insights, to present a clear, credible case for your chosen course of action.
Analysts typically structure their recommendations by considering several key factors:
You evaluate the accuracy and consistency of your forecasts, using them as a proxy for your expertise and the reliability of your conclusions.
You adjust your recommendation based on the company’s investment behavior, the level of information asymmetry, and the strength of its governance environment.
You act as an information intermediary, providing investors with insights that go beyond raw numbers, and as a monitoring agent, engaging with management to ensure accountability.
You use high-quality forecasts to guide investment decisions, encouraging more aggressive investment when under-investment is likely and caution when over-investment is a risk.
You synthesize forecast quality metrics and firm-specific context to enhance your investment memo, ensuring that your recommendation is both data-driven and context-aware.
When you craft your investment memo, you should always anchor your thesis in the most compelling evidence from your deep dive equity report. For example, if your analysis reveals strong revenue growth, expanding margins, and a robust pipeline of new products, you might recommend a “Buy” rating with a specific price target. If you identify significant risks—such as market volatility or weak governance—you may suggest a more cautious approach, such as “Hold” or “Underperform.”
Remember: The best investment recommendations do not simply follow the numbers. They reflect your ability to interpret data, anticipate change, and communicate a clear vision for the investment opportunity.
By synthesizing your findings into a focused investment memo, you empower decision-makers to act with confidence. You demonstrate not only your analytical rigor but also your ability to see the bigger picture—connecting financial health, strategic positioning, and market dynamics into a single, actionable recommendation.
Report Structure
Organization
You create clarity and impact in your equity report by following a thoughtful structure. Begin with a clear narrative flow that guides your reader through the story—start with the problem, move to the solution, and highlight the impact. This approach helps your audience understand not just the data, but the meaning behind it.
Start with a strong framework that logically guides your reader from introduction to conclusion.
Use the ‘Rule of Three’—organize your main findings into three key sections or points to make them memorable.
Build a detailed outline with main sections and sub-sections, ensuring you cover all critical aspects and spot any gaps.
Break down content using headings and subheadings, making the report easy to navigate.
Apply visual hierarchy and consistent formatting—fonts, colors, and layout—to emphasize what matters most.
Support your claims with data, market research, or case studies, always interpreting findings rather than just presenting numbers.
Address limitations and uncertainties openly, which builds trust and credibility.
Tailor your content to your audience’s expertise, using clear, concise language and consistent terminology.
End with a strong call to action, guiding your reader on the next steps.
When you organize your report with intention, you transform complex analysis into a compelling narrative that inspires confidence and action.
Visuals
You bring your research to life with visuals that clarify, engage, and persuade. The right visual can turn dense data into an insight that sticks. Choose your visuals based on the story you want to tell and the needs of your audience.
Bar and column charts help you compare financial performance across companies or sectors.
Line graphs let you track trends over time, such as revenue growth or stock price movement.
Scatter plots reveal relationships between variables, like valuation multiples and returns.
Histograms show the distribution of data, such as volatility or returns.
Pie charts and treemaps illustrate how different segments contribute to the whole, like market share.
Heat maps highlight geographic or segment performance at a glance.
Sankey diagrams visualize flows, such as capital allocation or fund transfers.
Best practices for visuals include clarity—avoid clutter and focus on what supports your narrative. Use consistent color schemes and styles for a professional look. Tailor your visuals to your audience’s financial literacy, and always provide context, such as historical data for comparison. Highlight key data points with callouts or annotations, and use infographics to simplify complex information.
Thoughtful visuals do more than decorate your report—they illuminate your insights and help your audience see the story behind the numbers.
By combining strong organization with purposeful visuals, you create equity reports that not only inform but also inspire thoughtful action.
You now understand how a disciplined process leads to a deep dive equity report that stands out. You start by defining objectives, then move through data collection, company analysis, financial review, valuation, and risk assessment. Each process step builds your insight and sharpens your perspective. When you present findings with clarity, you transform research into actionable intelligence. Apply this process in your own work to elevate your equity analysis and drive better decisions.
FAQ
What is the most important part of a deep dive equity report?
You gain the most value from the synthesis section. This part connects your research, analysis, and insights into a clear investment thesis. It helps you see the bigger picture and make informed decisions.
How often should you update your equity report?
You should update your report after each quarterly earnings release or when significant news emerges. Regular updates ensure your analysis stays relevant and reflects the latest company developments.
Which financial metrics matter most in equity analysis?
Key metrics include revenue growth, operating margin, free cash flow, and return on equity. You should also track debt ratios and valuation multiples. These numbers reveal a company’s health and future potential.
Tip: Always compare these metrics to industry peers for context.
How do you balance qualitative and quantitative research?
You combine numbers with narratives. Quantitative data shows performance trends, while qualitative insights reveal management quality and strategy. Together, they give you a complete view of the company.
Use both types of research for a well-rounded analysis.
Trust your judgment when weighing their importance.
Reflect on your findings. The best reports blend data and human insight, helping you see beyond the obvious and think strategically about every investment opportunity.
Seeing Beyond the Numbers: Building Clarity Through Deep Equity Research
In the journey of long-term wealth creation, the ability to think critically, ask the right questions, and remain grounded in both data and context becomes invaluable. Conducting a deep dive equity report isn’t just about parsing through numbers—it’s about uncovering the narrative that drives a company’s potential. At VASRO, we believe that real insight emerges when rigorous financial analysis meets strategic curiosity. Our approach is rooted in precision and perspective, drawing from both quantitative frameworks and qualitative depth to illuminate the full picture. When you learn to evaluate business models, leadership quality, and market forces side by side with earnings reports and key ratios, you gain more than just knowledge—you gain foresight. And that kind of clarity, built over time and refined through disciplined inquiry, becomes one of the most powerful tools in any investor’s pursuit of sustainable financial success.
Disclaimer: The information provided on www.vasro.de is for general informational purposes only and does not constitute investment advice or a recommendation to invest in any particular asset or market. VASRO GmbH does not offer personalized investment advice, and the content on this website should not be relied upon as such. Visitors are encouraged to seek independent financial advice tailored to their specific circumstances before making any investment decisions. VASRO GmbH disclaims any liability for investment decisions made based on the information presented on this website.