


Imagine you log in to your investment dashboard and see ai-driven portfolio optimization at work. The system instantly analyzes thousands of tech stocks using tech equity scoring, drawing on real-time data to suggest changes that boost your portfolio’s performance. With ai and big data, you can spot market shifts and adjust your investing strategy before others even notice. Institutional investors now lead this shift, with 70% using ai tools for portfolio management in 2023 and a projected 91% by 2025:
Year | Adoption Rate of AI Tools in Portfolio Management |
|---|---|
2023 | 70% |
2025 | 91% (projected) |
You gain smarter investment insights and make decisions grounded in data, not just intuition.
Table of Contents
Key Takeaways
Tech equity scoring uses advanced algorithms to analyze financial and ESG metrics, helping you make informed investment decisions.
Real-time analytics allow you to monitor market trends and adjust your strategy instantly, enhancing your investment performance.
Ensemble learning combines multiple models to improve prediction accuracy, reducing risk in your portfolio management.
Prioritize data quality and integration to ensure reliable analysis and compliance with regulations in your investment workflow.
Maintain human oversight in AI-driven investing to ensure ethical decision-making and adapt to unexpected market changes.
Tech Equity Scoring
Scoring Models
You rely on tech equity scoring to evaluate the potential of technology stocks with precision. Scoring models use advanced machine learning algorithms to analyze vast amounts of financial data and esg metrics. These models help you identify patterns and trends that traditional analysis might miss. You see innovation in action as algorithms adapt to new market conditions and integrate esg metrics for a holistic view of sustainability and financial performance.
Common machine learning algorithms in tech equity scoring include:
Logistic Regression
Decision Trees
Random Forests
Support Vector Machines (SVM)
Neural Networks
Ensemble Methods
Deep Learning
Each algorithm processes financial metrics and esg metrics differently, allowing you to compare companies based on sustainability, esg integration, and financial strength. You gain market intelligence by using models that weigh esg metrics alongside financial metrics, giving you a strategic edge in portfolio optimization.
Tip: You can improve your adaptability by choosing scoring models that update in real time as new financial data and esg metrics become available.
Metrics and Data Sources
You measure tech equity scoring effectiveness by the quality and diversity of metrics and data sources. Financial metrics such as revenue growth, profit margins, and cash flow provide a foundation for analysis. You also consider esg metrics, which reflect a company’s sustainability practices and esg integration. These metrics include carbon footprint, diversity initiatives, and governance standards.
You gather data from financial statements, regulatory filings, news feeds, and sustainability reports. You also use alternative data sources like social media sentiment and supply chain analytics to enrich your understanding of esg metrics and financial metrics. You see how esg integration transforms your approach, making sustainability and financial metrics equally important in your decision-making process.
Metric Type | Example Metrics | Data Source |
|---|---|---|
Financial | Revenue, Profit Margin, Cash Flow | Financial Statements |
ESG | Carbon Footprint, Diversity, Governance | Sustainability Reports |
Alternative | Social Sentiment, Supply Chain | News Feeds, Analytics |
You build a robust tech equity scoring system by combining financial metrics, esg metrics, and sustainability data. This approach supports strategic growth and equity analysis, helping you make informed decisions in a rapidly changing market.
Big Data in Investing
Real-Time Analytics
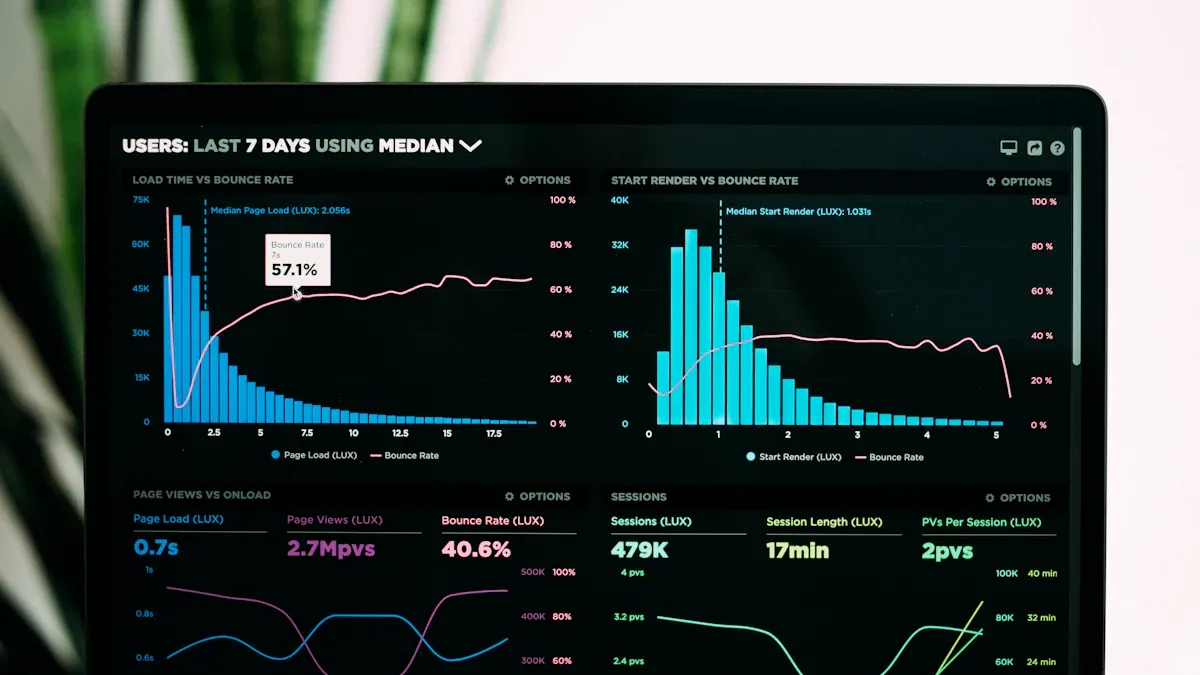
You experience a new era of investing when you harness real-time analytics. With real-time data, you gain immediate access to market movements, company performance, and emerging trends. This approach transforms your decision-making process. You no longer wait for quarterly reports. Instead, you use real-time monitoring to track stock prices, operational health, and even social sentiment as events unfold. Real-time data processing allows you to adapt your strategy instantly, whether you respond to a sudden shift in tech sector sentiment or monitor supply chain disruptions.
Note: Real-time monitoring platforms integrate data from sources like NYSE, NASDAQ, and alternative feeds such as satellite imagery or credit card transactions. This integration gives you a comprehensive view of the market.
You benefit from real-time monitoring in several ways:
You receive real-time alerts for liquidity or compliance risks.
You automate data feeds, freeing time for deeper analysis.
You improve risk management by continuously monitoring for early market signals.
Evidence Type | Description |
|---|---|
Real-time Insights | Big data provides immediate access to data, allowing for timely investment decisions. |
Predictive Analytics | Enables forecasting of revenues and earnings before official reports are released. |
Operational Monitoring | Tracks health of operations and market trends, enhancing decision-making accuracy. |
Mobile Big Data | Utilizes location data to predict key accounting variables and stock prices. |
Timeliness | Big data offers real-time information, unlike traditional quarterly or annual reports. |
You see how real-time monitoring and real-time data processing support smarter investing. You make decisions based on the latest insights, not outdated information.
Ensemble Learning
You strengthen your investing strategy with ensemble learning. This technique combines multiple models to improve the accuracy of your analysis. In tech equity scoring, ensemble learning increases predictive power and reduces risk. For example, stacked ensembles can boost stock price prediction accuracy by over 5%. Multi-resolution ensembles can improve market prediction accuracy by 8%. Portfolios built with ensemble models often see drawdowns reduced by up to 20%.
You use several ensemble learning techniques:
Deep ensembles aggregate outputs from different neural networks, increasing reliability.
Supervised learning links your investment objectives directly to model training.
End-to-end optimization embeds performance metrics, such as the Sharpe ratio, into the model’s core.
You rely on ensemble learning to enhance real-time monitoring and analysis. This approach helps you adapt to market changes, manage risk, and pursue strategic growth in your portfolio.
AI-Driven Portfolio Optimization

Predictive Analytics
You step into the world of ai-driven portfolio optimization and discover how predictive analytics transforms your investment approach. With real-time monitoring, you harness the power of big data to forecast market trends, anticipate risks, and identify opportunities before they become obvious to others. Predictive analytics uses a blend of historical data, statistical algorithms, and machine learning models to deliver accurate forecasts for technology equities. You see how these tools move beyond traditional financial models, offering you a sharper edge in portfolio optimization.
You rely on a range of predictive analytics techniques to enhance your risk-adjusted returns. Each method brings unique strengths to your analysis:
Technique | Description | Application Example |
|---|---|---|
Regression Analysis | Uncovers relationships between variables to forecast outcomes. | Predicting sales growth or pricing trends. |
Time Series Analysis | Analyzes sequential data over time to identify patterns and trends. | Stock market forecasting. |
Decision Trees | Simplifies complex decision-making by splitting data into branches based on conditions. | Credit scoring and customer segmentation. |
Clustering | Groups similar data points to uncover hidden patterns. | Market segmentation and anomaly detection. |
Neural Networks | Mimics human brain structure to analyze complex datasets. | Product recommendations in e-commerce. |
Ensemble Methods | Combines multiple models to improve accuracy and reliability. | Predicting patient outcomes in healthcare. |
Support Vector Machines | Creates optimal boundaries between data points for classification problems. | Sentiment analysis and image categorization. |
Natural Language Processing | Enables machines to understand human language for trend analysis and engagement improvement. | Analyzing customer feedback and social media. |
You use these techniques to process real-time data streams, allowing you to adapt your strategy as new information emerges. Predictive modeling lets you forecast investment outcomes by analyzing historical data and current market conditions. Machine learning algorithms predict cash flows, valuation changes, and market behavior, giving you a dynamic view of your portfolio’s potential. You identify optimal entry and exit points, maximizing risk-adjusted returns throughout the investment lifecycle. When you spot underperforming assets, you intervene early, steering your portfolio toward profitable growth.
Tip: Predictive analytics not only forecasts financial outcomes but also helps you anticipate risks and detect fraudulent activities. By identifying patterns in past data, you optimize investments and enhance decision-making.
You notice that ai-driven portfolio optimization consistently outperforms traditional models. In bull markets, you see an average return increase of 12%. During bear markets, your system reallocates to lower-risk assets, protecting your capital more effectively. When volatility spikes, your risk-adjusted returns remain strong, with Sharpe ratios 0.25 points higher than benchmarks. Across all conditions, you achieve an average Sharpe ratio of 1.45, compared to 1.1 for CAPM-based portfolios. You also experience 10% lower average volatility than with mean-variance optimization, reducing fluctuations in your returns.
Market Condition | Performance Metric | Comparison to Traditional Models |
|---|---|---|
Bull Market | Average return increase of 12% | Outperformed traditional models |
Bear Market | Mitigated losses by reallocating to lower-risk assets | More effective capital protection |
High Volatility | Sharpe ratio 0.25 points higher than benchmarks | Better risk-adjusted returns |
Overall Performance | Average Sharpe ratio of 1.45 vs 1.1 for CAPM-based portfolios | Superior risk-adjusted performance |
Volatility | 10% lower average volatility than MVO portfolios | Reduced fluctuations in returns |
You see how real-time monitoring and predictive analytics work together to deliver superior risk-adjusted returns. Your investment decisions become more informed, timely, and resilient in the face of market uncertainty.
Risk Management
You recognize that risk management stands at the heart of ai-driven portfolio optimization. With real-time monitoring, you track your portfolio’s exposure to various risks and respond instantly to changing conditions. Adaptive risk management frameworks help you maintain stability and pursue growth, even in turbulent markets.
You use several risk management frameworks to safeguard your investments:
Framework | Description |
|---|---|
Value at Risk (VaR) | Estimates potential loss in value of an asset or portfolio over a defined period for a given confidence interval. |
Stress Testing | Simulates extreme market conditions to evaluate how a portfolio would perform under stress. |
Scenario Analysis | Assesses the impact of different hypothetical scenarios on investment performance. |
You rely on ai-driven portfolio optimization to identify and mitigate a wide range of risks. Real-time monitoring enables you to forecast trends, analyze borrower data, and automate compliance. You monitor system vulnerabilities, forecast asset demand, and validate your models continuously. You also analyze global economic indicators to predict currency fluctuations and quantify over-exposure to specific sectors. When regulations change, your system flags non-compliant activities, keeping your portfolio aligned with the latest standards. Extreme event simulations and stress tests help you prepare for black swan risks, while interest rate predictions and systemic risk analysis keep your strategy robust.
Risk Type | |
|---|---|
Market Risk | Uses predictive analytics to forecast trends and manage portfolios. |
Credit Risk | Analyzes borrower data with enhanced accuracy. |
Operational Risk | Automates compliance and fraud detection. |
Technology Risk | Monitors system vulnerabilities and performance in real-time. |
Liquidity Risk | Forecasts asset demand and market depth. |
Model Risk | Continuously validates and updates AI models against new data. |
Currency Risk | Analyzes global economic indicators to predict exchange rate fluctuations. |
Concentration Risk | Identifies and quantifies over-exposure to specific assets or sectors. |
Regulatory Risk | Monitors for changes in regulations and flags non-compliant activities. |
Black Swan Risk | Runs extreme event simulations and stress tests. |
Interest Rate Risk | Predicts the impact of rate changes on fixed-income assets. |
Systemic Risk | Analyzes interdependencies across financial markets to detect potential domino effects. |
You benefit from adaptive risk management that evolves with your portfolio’s needs. Real-time monitoring ensures you never miss a critical signal. You see how ai-driven portfolio optimization delivers superior risk-adjusted returns by diversifying risk, enhancing resilience, and supporting strategic growth. The Hierarchical Risk Parity (HRP) model, for example, achieved a 4.91% return when traditional mean-variance optimization posted a loss of 2.38%. This demonstrates how ai-driven portfolio optimization not only diversifies risk more effectively but also enhances risk-adjusted returns, especially during volatile periods.
You realize that ai-driven portfolio optimization empowers you to pursue innovation, equity analysis, and market intelligence with confidence. Real-time monitoring and adaptive risk management give you the tools to optimize your portfolio, achieve superior risk-adjusted returns, and adapt to the ever-changing landscape of technology equities.
Implementation for Investors
Data Integration
You begin your journey toward effective investment management by focusing on data integration and processing. Clean, unified data from sources such as CRM systems, website interactions, and email engagement forms the backbone of your tech equity scoring system. You recognize that incomplete or inconsistent data can undermine the accuracy of your analysis and esg integration. You conduct regular audits of your data practices to ensure reliability before implementing real-time predictive tools. You prioritize data integration and processing to support robust portfolio construction and performance monitoring. You see how high-quality data integration and processing drive innovation, equity analysis, and strategic growth in your investment workflow.
You gather data from multiple sources for esg analysis and portfolio allocations.
You ensure real-time monitoring of data integration and processing for regulatory compliance.
You use performance monitoring to validate the accuracy of your investment analysis.
Tip: You improve investment management by maintaining strict regulatory compliance and monitoring data integration and processing for esg metrics.
Model Selection
You select models that align with your investment goals and risk tolerance. Portfolio optimization requires you to choose the optimal mix of investments for maximum returns and minimal risk. You explore hybrid ai models for stock portfolio optimization, including intrinsic value calculations and comprehensive financial health analysis. You use nature-inspired algorithms for selection and optimization, enhancing your portfolio allocations and construction. You rely on real-time monitoring and esg integration to refine your investment analysis and performance monitoring.
You evaluate models for esg integration and real-time monitoring.
You use financial health analysis to guide portfolio construction and allocations.
You select models that support regulatory compliance and performance monitoring.
Note: You achieve strategic growth by combining ai-driven analysis with esg metrics and real-time monitoring in your investment management process.
Workflow Alignment
You adjust your investment workflow to accommodate ai-driven portfolio optimization tools. You shift from periodic reviews to continuous real-time monitoring of your portfolio allocations and construction. You update your financial goals regularly in response to life changes, ensuring your investment management remains relevant. You combine ai’s analytical strengths with human judgment for better decision-making, maintaining oversight and ethical standards. You ensure regulatory compliance by monitoring esg integration and performance monitoring throughout your workflow.
Challenge | Description |
|---|---|
You manage sensitive data and monitor for breaches, maintaining regulatory compliance in your investment workflow. | |
Lack of Transparency and Explainability | You build trust by using explainable ai techniques and monitoring model outputs for esg integration and analysis. |
Human Oversight in AI-Powered Models | You maintain human judgment and ethical standards, monitoring ai recommendations for portfolio allocations and construction. |
Integration with Legacy Systems | You overcome outdated infrastructure by adopting cloud-based solutions and phased implementation, supporting real-time monitoring and regulatory compliance. |
Employee Resistance to AI Adoption | You address concerns through training, positioning ai as a tool for innovation and strategic growth in investment management. |
You see how ongoing human oversight and regular reviews of ai-generated recommendations ensure your investment analysis aligns with your personal financial goals and risk tolerance. You combine real-time monitoring, esg integration, and performance monitoring to achieve superior portfolio allocations and construction. You maintain regulatory compliance and adapt your investment workflow for continuous innovation and market intelligence.
Challenges and Considerations
Data Quality
You depend on high-quality data for every investment decision. Real-time data streams power your tech equity scoring, but you must ensure that each data point is accurate and reliable. Incomplete or inconsistent data can distort your esg analysis and weaken your institutional investment performance. You regularly audit your real-time data sources, checking for errors and gaps. You know that real-time data integration supports your compliance efforts, as regulators expect you to document your data lineage. You use real-time validation tools to confirm the accuracy of esg metrics, which strengthens your compliance posture and supports your investment strategy.
Transparency
You build trust with clients and regulators by prioritizing transparency in your real-time investment process. You use explainable AI to clarify how your real-time models make decisions, which helps you communicate your esg approach. You maintain continuous documentation and audit trails for every real-time investment action, making compliance reviews more efficient. You know that transparency and explainability are essential for compliance and for demonstrating your commitment to ethical investing. You ensure that your real-time investment reports clearly show how esg factors influence your institutional investment performance.
Transparency and explainability are crucial for compliance and building client trust.
Explainable AI provides clear reasoning for investment decisions, ensuring that advisors can communicate effectively with clients.
Continuous documentation and audit trails simplify compliance reviews and demonstrate adherence to regulatory guidelines.
Compliance
You face strict compliance requirements when you use real-time big data and AI in your investment workflow. You conduct due diligence on every real-time data and AI vendor, ensuring they meet compliance standards under the Investment Advisers Act of 1940. You demand detailed information about real-time data provenance and esg data sources, confirming that all third-party rights are respected. You stay alert to insider trading risks, requiring vendors to understand compliance rules about material nonpublic information. You establish a real-time escalation process for compliance issues, ensuring prompt notification of any concerns. You adopt formal compliance policies for data privacy and insider trading, and you provide regular compliance training for your team. You prepare for follow-up questions about real-time data rights and compliance documentation. You make sure your due diligence process supports your relationships with key clients and maintains your institutional investment performance.
Due diligence: You review real-time data and AI vendors for compliance with securities laws.
Data provenance: You verify the sources of real-time data and esg metrics.
Insider trading awareness: You ensure vendors understand compliance risks.
Escalation process: You set up real-time alerts for compliance issues.
Formal compliance policies: You implement policies for data privacy and insider trading.
Compliance training: You train your team on compliance best practices.
Follow-up on data rights: You answer detailed compliance questions about data.
Timely diligence process: You balance compliance with client relationships.
Human Oversight
You recognize that real-time AI-driven investment tools require human oversight to ensure ethical outcomes. You monitor your real-time models for signs of market manipulation or unfair trading advantages, maintaining compliance and upholding esg standards. You use your judgment to interpret real-time events, such as economic shifts or regulatory changes, that algorithms may not fully understand. You factor in ethical considerations, ensuring your real-time investment decisions reflect your values and support institutional investment performance. You guide your real-time AI systems to prevent unintended discriminatory outcomes, reinforcing your commitment to compliance and esg integration.
Human oversight prevents market manipulation and ensures compliance.
You interpret unexpected real-time events better than algorithms.
You address ethical challenges in real-time investment decisions.
You guide AI to avoid discriminatory outcomes and support esg goals.
You see how tech equity scoring and AI-driven portfolio optimization bring innovation and adaptability to your investing journey. These tools help you analyze market intelligence and support strategic growth, but you must stay aware of data quality and transparency challenges. You balance technology with your own judgment to make thoughtful investment decisions. Consider exploring new resources on equity analysis and big data in investing. Reflect on how you can use these insights to shape your portfolio for the future.
FAQ
What is tech equity scoring?
Tech equity scoring helps you evaluate technology stocks using data-driven models. You analyze financial and ESG metrics to compare companies. This approach supports smarter decisions and gives you deeper market intelligence.
How does big data improve portfolio optimization?
Big data lets you process huge amounts of information in real time. You spot trends, monitor risks, and adapt your strategy quickly. This helps you pursue innovation and strategic growth with confidence.
Why is human oversight important in AI-driven investing?
You provide ethical judgment and context that algorithms may miss. Human oversight ensures your investment decisions reflect your values and adapt to unexpected events. You maintain trust and transparency in your workflow.
What challenges should you expect when integrating AI tools?
You may face data quality issues, transparency concerns, and compliance requirements. You need to audit your data, explain model decisions, and follow regulations. Training and ongoing review help you align technology with your goals.
Making Sense of Markets: The Role of Objective Equity Research
Understanding market behavior requires more than surface-level observation—it calls for disciplined inquiry grounded in reliable data, contextual awareness, and transparent methodology. Objective equity research is not about forecasting outcomes but about clarifying the structures and signals that shape how markets function, reducing noise so that underlying dynamics become visible. By carefully gathering diverse information, applying rigor in analysis, and openly framing assumptions, research can highlight connections that might otherwise remain obscured. At VASRO, this approach reflects a commitment to curiosity, precision, and clarity, offering a measured perspective in equity analysis and market intelligence that helps illuminate complexity without oversimplification. This article is for general information only and does not constitute financial, investment, legal, or tax advice; readers should consult a licensed professional for advice tailored to their situation.
Disclaimer: The information on www.vasro.de is for general informational purposes only and does not constitute investment advice or a recommendation. VASRO GmbH does not provide personalized investment advice; visitors should seek independent financial guidance before making decisions. Some content may rely on third-party sources considered reliable, but VASRO GmbH does not guarantee accuracy, completeness, or timeliness. All information is provided “as is,” may change without notice, and VASRO GmbH has no obligation to update, correct, or continue publishing it. VASRO GmbH accepts no liability for losses arising from reliance on this information. Past performance is not a reliable indicator of future results.