


Small-cap tech stocks often attract investors seeking growth, yet these stocks present both significant opportunities and unique challenges. Equity report techniques serve as essential tools for uncovering hidden value, especially when small cap stocks trade at lower price-to-earnings ratios and often receive less analyst coverage. Investors notice that small-cap indices are forecasted to achieve double-digit earnings per share growth through 2026, outpacing larger companies. These trends, combined with a recovering IPO market and favorable macroeconomic conditions, create a landscape where disciplined analysis can reveal opportunities that others may overlook. A multi-angle approach—blending quantitative metrics, qualitative insights, and risk management—empowers investors to make informed decisions and maximize the potential of small-cap tech investing.
Table of Contents
Key Takeaways
Small-cap tech stocks often trade below their true value due to less analyst coverage and market inefficiencies, creating opportunities for careful investors.
Key financial metrics like low price-to-earnings and price-to-book ratios, high return on equity, and strong cash flow help identify undervalued small-cap tech companies.
Qualitative factors such as strong management, innovation, and unique industry positioning play a vital role in uncovering hidden value beyond numbers.
Using tools like stock screeners, monitoring unusual options activity, and tracking institutional ownership can improve the chances of finding promising small-cap tech stocks.
Managing risks through diversification, avoiding value traps, and monitoring liquidity ensures a balanced approach to investing in volatile small-cap tech stocks.
Why Small Cap Stocks Hide Value
Market Inefficiencies
Market inefficiencies often create fertile ground for opportunities in small cap stocks. Many small-cap tech stocks operate outside the radar of large index funds and institutional investors. This limited indexing and lower institutional ownership lead to less efficient pricing, as fewer market participants analyze these companies in depth. An experienced small-cap fund manager notes that these inefficiencies arise because small cap equities receive less attention from analysts and large funds, allowing hidden value to persist. Skilled managers who adopt a private equity mindset and engage directly with management teams can uncover overlooked small-cap companies that possess strong fundamentals but remain undervalued.
Investors seeking opportunities for small caps should pay close attention to key valuation metrics that highlight inefficiencies.
Price-to-Earnings (P/E) Ratio: Lower P/E ratios may indicate undervaluation, especially when compared to industry peers.
Price-to-Book (P/B) Ratio: A low P/B ratio can signal that the market undervalues the company’s assets.
Enterprise Value to EBITDA (EV/EBITDA): Ratios below 10 often suggest attractive valuations.
Return on Equity (ROE): High ROE, when paired with a low P/B, may reveal efficient capital use and hidden value.
Dividend Yield and Earnings Yield: Higher yields can point to undervalued stocks with strong cash flow potential.
These metrics, when used thoughtfully, help investors identify opportunities that arise from market inefficiencies in small cap stocks.
Undercoverage and Mispricing
Undercoverage remains a defining feature of the small cap landscape. Many small cap stocks receive little or no analyst coverage, which leads to informational gaps and mispricing. Empirical studies show that small-cap equity managers often generate abnormal returns by exploiting these gaps. The lack of coverage means that temporary setbacks or depressed profitability can cause the market to overreact, pushing prices below intrinsic value. For example, normalized valuation multiples such as P/E and P/B ratios for small-cap portfolios often fall well below those of broader indices, reflecting undervaluation rather than fundamental weakness.
This environment creates opportunities for investors who conduct thorough research and maintain a long-term perspective. By focusing on overlooked small-cap companies with solid balance sheets and recovery potential, investors can find value where others see only risk. The persistent mispricing in small cap equities highlights the importance of diligent analysis and a willingness to look beyond the headlines.
Small-Cap Tech Stocks: Key Metrics

P/E and P/B Ratios
Investors often begin their analysis of small-cap tech stocks by examining valuation ratios such as price-to-earnings (P/E) and price-to-book (P/B). These ratios serve as quick indicators of whether a stock trades below its intrinsic value. A P/E ratio lower than the industry average may signal that the market has overlooked a company’s growth potential, especially if the business holds patents or operates in a specialized niche. Similarly, a P/B ratio below 1 suggests the stock trades for less than the value of its assets, which can point to hidden value.
Tip: Always compare these ratios to sector norms and consider the company’s growth prospects and financial health before drawing conclusions.
The following table summarizes how these metrics support the search for undervalued opportunities:
Metric | Description |
|---|---|
P/E Ratio | Gauges undervaluation; a lower P/E may indicate a buying opportunity but requires context. |
P/B Ratio | Below 1 suggests the stock trades below asset value, indicating potential undervaluation. |
ROE | High ROE signals efficient earnings generation, supporting valuation analysis. |
EPS Growth | Consistent growth signals strong prospects, complementing valuation ratios. |
Backtest Annual Return | 12% average annual return over 10 years using low P/E, low P/B, high ROE, and EPS growth. |
Sharpe Ratio | 1.2, indicating good risk-adjusted returns for the strategy. |
Maximum Drawdown | 15%, showing relatively low risk in the strategy. |
Historical data shows that small-cap strategies focusing on low P/E, low P/B, and high ROE have delivered attractive risk-adjusted returns. However, investors must remain cautious. Low ratios can sometimes signal underlying business challenges rather than genuine undervaluation. By layering in other metrics and qualitative insights, investors can avoid value traps and focus on companies with true upside potential.
Cash Flow and ROE
Cash flow and return on equity (ROE) provide deeper insight into a company’s operational strength and management effectiveness. Rising free cash flow (FCF) yield often signals that a company generates cash efficiently, which can fund future growth or return value to shareholders. A PEG ratio below 1.0, which adjusts the P/E ratio for expected earnings growth, further highlights undervaluation relative to growth prospects.
Small-cap tech stocks with strong earnings growth rates—sometimes exceeding 100%—demonstrate the sector’s potential for outsized returns. For instance, companies like Seojin System Ltd. and Fine M-Tec Ltd. have posted earnings growth rates of nearly 40% and over 130%, respectively. High insider ownership, such as 25% or more, often aligns management’s interests with those of shareholders, reinforcing confidence in the company’s future.
Key Metrics to Watch:
Earnings Growth Rate: Reveals expansion potential.
ROE: Measures profitability and management skill.
Free Cash Flow: Indicates ability to reinvest and create value.
Insider Ownership: Shows management’s commitment to long-term success.
Note: Combining these metrics with valuation ratios helps investors identify small-cap tech stocks trading below intrinsic value despite strong fundamentals.
Debt and Balance Sheet Strength
A careful review of the balance sheet can reveal both hidden risks and hidden value. Debt levels, interest coverage, and asset quality all play crucial roles in determining a company’s resilience, especially in a rising interest rate environment. Small-cap companies often face higher costs to service debt, with about 25% of operating earnings in small-cap indexes like the S&P 600 and Russell 2000 going toward interest expenses. Companies with lower leverage and higher operating profitability tend to manage these costs more effectively.
Investors should look for companies with manageable debt loads, strong cash reserves, and high-quality assets. These factors not only reduce risk but also position the company to capitalize on future growth opportunities.
Balance Sheet Metrics to Analyze:
Debt-to-Equity Ratio: Lower ratios suggest less financial risk.
Interest Coverage Ratio: Higher values indicate better ability to service debt.
Return on Assets (ROA): Measures how efficiently assets generate earnings.
Hidden Assets: Intangible assets, such as intellectual property, can add unrecognized value.
Quality-focused strategies, such as those used by funds overweighting high-ROE stocks, have outperformed broader small-cap indexes by significant margins. This outperformance highlights the importance of balance sheet strength in driving small cap performance and managing interest rate sensitivity.
Benchmarks like the Russell 2000 provide context for evaluating risk and return. Small-cap stocks have historically delivered an average annual return premium of nearly 3% over large caps, though with higher volatility. By combining key metrics with benchmark comparisons, investors can better manage risk and uncover opportunities in this dynamic segment.
Qualitative Analysis for Hidden Value
Management Quality
Investors often find that the true engine behind a small-cap tech company’s success lies in the quality of its management team. Leadership with a clear vision, deep industry experience, and a strong ethical foundation can transform a modest business into a market leader. Chris Waller observes that many overlooked small-cap companies in niche sectors benefit from owner-operators who treat their businesses like personal ventures. These leaders build franchise-like models, foster valuable relationships, and operate with integrity—traits that rarely appear in financial statements but drive high returns on capital, sometimes reaching 15-20%.
A disciplined analysis of management quality involves more than reviewing résumés. Investors should look for evidence of prudent capital allocation, transparent communication, and a track record of navigating industry cycles. The “scuttlebutt” approach—gathering insights from employees, suppliers, and customers—often reveals qualitative moats that traditional metrics miss. When management demonstrates both operational skill and a commitment to long-term value creation, the company stands a better chance of unlocking hidden value that the broader market may overlook.
Tip: Pay attention to insider ownership levels and management tenure. High insider stakes often align leadership’s interests with those of shareholders, signaling confidence in the company’s future.
Innovation and Product Pipeline
Innovation sits at the heart of every thriving tech company, especially in the small-cap space where agility and creativity can outpace larger competitors. A robust product pipeline signals not only current relevance but also future growth potential. Investors should examine the company’s investment in research and development, the frequency of new product launches, and the uniqueness of its technology.
Companies that consistently introduce differentiated products or hold patents in emerging fields often command a competitive edge. The ability to adapt quickly to market changes and anticipate customer needs sets these firms apart. When evaluating opportunities, investors should look for signs of a culture that encourages experimentation and rewards calculated risk-taking. This mindset often leads to breakthroughs that drive both revenue and market share.
A thoughtful analysis of innovation also considers the scalability of new products and the company’s capacity to protect its intellectual property. Firms with a steady stream of new offerings and a strong patent portfolio tend to weather industry disruptions more effectively, positioning themselves for sustained growth.
Industry Positioning
Industry positioning plays a crucial role in determining a small-cap tech company’s financial performance. Companies that carve out a unique space—through technology differentiation, strong R&D intensity, or a well-defended patent portfolio—often achieve superior results. Recent research demonstrates a clear link between these positioning measures and firm value, as reflected in Tobin’s Q, a common indicator of market performance.
The following table summarizes how different industry positioning strategies impact financial outcomes for technology-focused firms:
Measure | Effect on Firm Performance (Tobin’s Q) | Significance Level | Notes |
|---|---|---|---|
Tech Differentiation | +10.4% increase per 1 SD increase | 1% significance | Based on patent text analysis; robust with firm fixed effects |
Tech Differentiation (doc2vec) | +6.9% increase per 1 SD increase | Significant | Alternative text-based measure |
R&D Intensity | +4.3% increase per 1 SD increase | Significant | Traditional innovation measure |
Citation-weighted Patents | +18.3% increase per 1 SD increase | Significant | Reflects size and impact of patent portfolio |
Industry Context | Effect Size on Tobin’s Q | Significance | Notes |
|---|---|---|---|
High R&D Intensity | +12.0% increase per 1 SD tech diff. | p = 0.000 | Stronger effect in tech-intensive industries (e.g., medical equipment) |
Low R&D Intensity | +4.5% increase per 1 SD tech diff. | p = 0.024 | Weaker effect in less R&D intensive industries (e.g., food manufacturing) |
High Product Market Rivalry | Stronger positive relation | Significant | Typical in tech sectors like computer hardware |
| Applicability to Small Firms | Robust for firms with few patents | N/A | Method works well even for firms with small patent portfolios, implying relevance to small-cap tech companies |
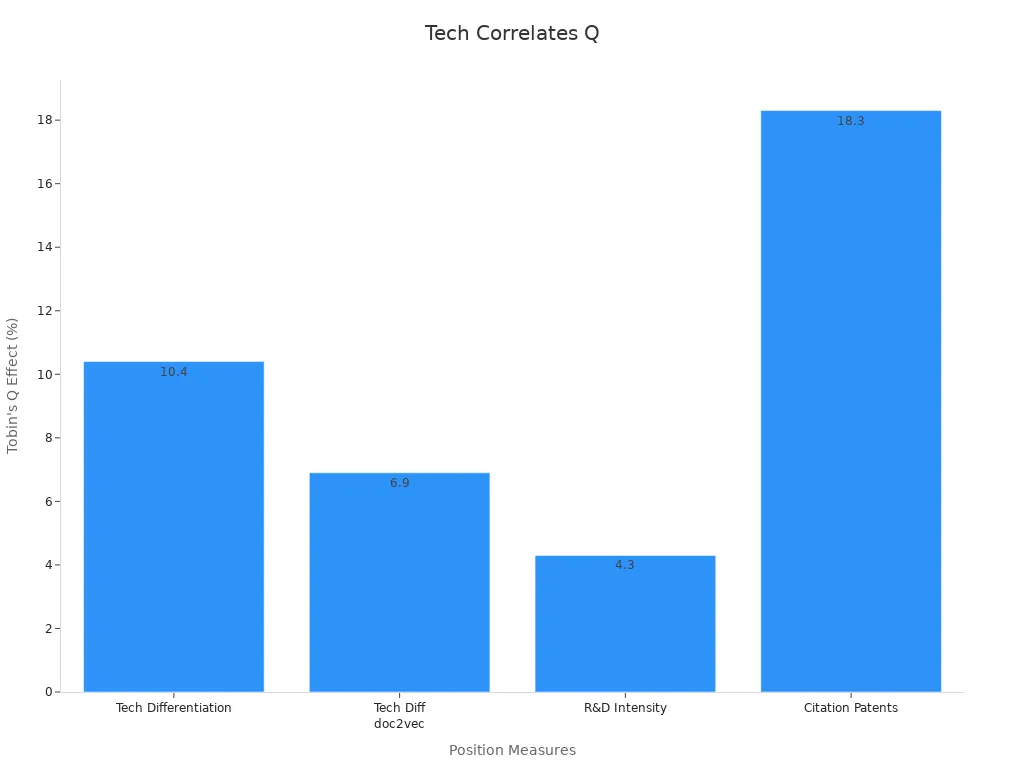
This data shows that technology differentiation, R&D intensity, and patent quality all correlate with higher firm value, especially in sectors marked by rapid change and intense competition. Even small firms with limited patent portfolios can benefit from these strategies, making industry positioning a vital area for qualitative analysis.
Note: Investors who combine management assessment, innovation review, and industry positioning analysis gain a multi-dimensional view of opportunities in small-cap tech. This approach helps identify companies with the potential for outsized returns—often hiding in plain sight.
A thoughtful, qualitative lens allows investors to see beyond the numbers. By focusing on leadership, innovation, and strategic market placement, they can uncover opportunities that quantitative screens alone might miss. In the world of small-cap tech, the most valuable assets often remain invisible to those who do not look closely enough.
Quantitative Screening Techniques
Stock Screeners
Stock screeners serve as a powerful starting point for investors searching for hidden value in small-cap tech stocks. These tools allow users to filter companies based on specific financial metrics, such as low price-to-earnings (P/E) and price-to-book (P/B) ratios. Over time, empirical research has shown that small-cap stocks identified by these criteria often outperform their large-cap counterparts. Value and size factors, which screen for undervalued small-cap stocks, have historically provided resilience during bear markets and economic downturns. For example, during the 2008 financial crisis, these factors helped investors protect capital and recover more quickly. In contrast, momentum and growth factors excelled during the late 1990s technology boom, demonstrating the adaptability of factor-based screening. Jim O’Shaughnessy’s approach, which adjusts factor weights over time, further supports the effectiveness of quantitative screeners in capturing opportunities across different market cycles.
Investors who use screeners thoughtfully can adapt their strategies to changing market conditions, increasing the likelihood of uncovering undervalued gems in the small-cap tech universe.
Options Activity Signals
Unusual options activity (UOA) can act as an early signal of hidden value in small-cap tech equities. When investors notice a surge in call or put options, it often indicates that informed market participants anticipate significant price movement. The following table highlights several real-world examples where UOA preceded major events:
Example Company | Numerical Evidence | Context |
|---|---|---|
General UOA Impact | Stocks with unusual options activity are 5x more likely to see major moves | Predictive power of UOA |
Zendesk (June 2022) | 50% price surge after spike in far OTM call options | UOA signaled buyout before public announcement |
Gluu Mobile (2020-2021) | Large-scale options activity before $12.50/share acquisition | UOA and technical signals anticipated institutional interest |
Activision (Pre-MSFT) | Call options surged 11x after heavy buying in oversold conditions | UOA aligned with technicals, providing early entry before acquisition |
Monitoring options activity can help investors spot institutional moves and potential catalysts before they become widely known.
Institutional and Analyst Activity
Institutional and analyst activity offers another layer of quantitative insight. Investors often track changes in institutional ownership, analyst upgrades, and coverage initiations to gauge market sentiment and information flow. Recent statistical studies highlight several effective screening techniques:
Trend-following and momentum-based technical trading rules remain robust for small-cap tech stocks, especially when exploiting positive autocorrelation in returns.
Proper statistical adjustments, such as White’s Reality Check, help avoid data snooping bias and ensure reliable results.
These techniques delivered significant profits in small-cap tech indices during the late 1990s and early 2000s, though their effectiveness has moderated as markets have become more efficient.
By combining stock screeners, options activity monitoring, and institutional tracking, investors can build a comprehensive toolkit for uncovering hidden value in small-cap tech stocks. This multi-pronged approach not only increases the odds of success but also deepens understanding of the ever-evolving market landscape.
Risk Management in Small Cap Stocks
Value Traps and Red Flags
Investors often encounter value traps when analyzing small cap stocks. These traps occur when a stock appears undervalued based on traditional metrics, yet underlying business weaknesses persist. Warning signs include declining revenue, persistent negative cash flow, or management turnover. Companies with high debt levels or inconsistent earnings may also signal trouble. Rigorous due diligence helps investors distinguish between genuine bargains and stocks that mask deeper issues. Reviewing recent filings, understanding the competitive landscape, and questioning management’s strategic direction all form part of a robust due diligence process.
Volatility and Liquidity
Small cap equities frequently experience higher volatility and liquidity challenges compared to larger firms. Their prices can swing sharply due to limited trading volumes, wider bid-ask spreads, and lower analyst coverage. These factors make it difficult to enter or exit positions without impacting share prices. Many small cap stocks rely on external financing, which increases vulnerability during market downturns. Nearly 40% of these companies remain unprofitable, amplifying their sensitivity to market shifts. Investors must recognize that performance risks often stem from a combination of market fluctuations, liquidity constraints, and limited transparency. Active monitoring and risk controls become essential in managing these exposures.
Tip: Investors should monitor trading volumes and bid-ask spreads before making an allocation to small cap stocks, as these indicators reveal potential liquidity risks.
Diversification Strategies
Diversification stands as a cornerstone of risk management in small cap investing. By spreading allocation to small cap holdings across sectors, geographies, and asset classes, investors can reduce portfolio volatility and lower beta. For example, combining U.S. small cap equities with international stocks and bonds creates a more stable portfolio. During periods of market stress, assets with negative correlations—such as Treasury bonds—can offset losses in equities. The barbell approach, which balances riskier small cap stocks with safer assets, further enhances resilience. Global diversification and thorough due diligence on each holding help investors navigate uncertainty and improve long-term performance.
A thoughtful risk management strategy not only protects capital but also positions investors to capture opportunities as markets evolve.
Action Steps to Find Hidden Value
Research Process
A disciplined research process forms the backbone of successful small-cap tech investing. Investors begin by conducting fundamental analysis, reviewing financial statements to assess revenue trends, profitability, and debt levels. They estimate intrinsic value and compare it to the current market price to identify undervalued stocks. Relative valuation follows, with investors benchmarking key ratios like P/E and P/S against industry peers. Technical analysis adds another layer, as price and volume patterns can reveal hidden opportunities or signal reversals. Many investors also adopt a contrarian mindset, seeking companies temporarily out of favor due to short-term setbacks. Combining these approaches with a focus on competitive advantage and industry trends uncovers stocks with sustainable moats and long-term growth prospects. Empirical research supports a multi-factor strategy—blending value, momentum, and quality screens—to filter out value traps and enhance returns. Dynamic frameworks that adjust factor weights over time, sometimes using AI, further refine the process and adapt to changing market cycles.
Leveraging Tools and Data
Modern analytical tools and data platforms empower investors to detect undervalued small-cap tech stocks with greater precision. These platforms integrate real-time data, enabling timely responses to market shifts. Investors use multi-criteria screeners to combine valuation, growth, momentum, and quality indicators, refining their search for hidden value. Customizable filters and technical metrics, such as moving averages or RSI, help identify trend reversals and breakout opportunities. The integration of AI and machine learning enhances predictive accuracy by recognizing complex patterns and adapting to new information. User-friendly dashboards and advanced screening platforms like Finviz, Stock Rover, and TradingView streamline the process, supporting disciplined decision-making. While these tools offer significant advantages, investors remain mindful of limitations such as data accuracy and the need for qualitative insights. By complementing quantitative analysis with broader market awareness, investors maximize their ability to uncover overlooked opportunities.
Buy, Hold, or Sell Decisions
Deciding when to buy, hold, or sell small-cap tech stocks requires a blend of quantitative and qualitative insights. Investors monitor key metrics such as revenue growth, profit margins, debt levels, and cash flow to assess financial health and operational efficiency. Screening tools and sentiment analysis—tracking analyst coverage, insider buying, and institutional ownership—offer additional perspectives on market interest. Qualitative due diligence remains essential, as management quality, business model strength, and industry positioning often drive long-term performance. Risk management strategies, including diversification, position sizing, and regular portfolio reviews, guide decisions to hold or exit positions. The story of Axon Enterprise illustrates how combining strong financial indicators with visionary leadership and favorable industry trends can lead to exceptional returns. Ultimately, investors who integrate data-driven analysis with thoughtful judgment position themselves to capture hidden value and seize new opportunities as they emerge.
Thoughtful research, adaptive tools, and disciplined decision-making create a foundation for uncovering hidden value in small-cap tech stocks. By embracing a holistic approach, investors not only identify promising investments but also cultivate the resilience and insight needed to thrive in a dynamic market.
Investors who seek hidden value in small-cap tech stocks benefit from a disciplined blend of quantitative screening, qualitative analysis, and robust risk management. The small-cap universe offers a broad landscape for discovery:
Nearly 75% of U.S. listed companies are small caps, providing diverse opportunities.
These companies often grow faster than large caps and show lower correlation, enhancing diversification.
Limited analyst coverage creates inefficiencies that skilled investors can exploit.
A notable case, the Dimensional Fund Advisors’ 9–10 Fund, achieved a 2.2% annual premium over its benchmark by applying specialized strategies. Those who embrace continuous research and active engagement can uncover overlooked potential. Every thoughtful step brings new insight and the chance to shape a more resilient portfolio.
FAQ
What makes small-cap tech stocks attractive for equity analysis?
Small-cap tech stocks often grow faster than large companies. They receive less analyst coverage, which creates opportunities for investors who conduct thorough research. These stocks can offer hidden value for those who use disciplined analysis and remain patient.
How can investors avoid value traps in small-cap tech stocks?
Investors should look beyond low valuation ratios. They need to check cash flow, debt levels, and management quality. Reviewing recent filings and understanding the company’s business model helps avoid companies that only appear undervalued.
Which tools help identify hidden value in small-cap tech stocks?
Investors use stock screeners, options activity monitors, and institutional ownership trackers. Platforms like Finviz and TradingView provide real-time data and customizable filters. Combining these tools with qualitative research uncovers overlooked opportunities.
Why does limited analyst coverage matter for small-cap stocks?
Limited coverage means fewer professionals analyze these companies. This often leads to mispricing and market inefficiencies. Investors who perform their own research can find value that others miss.
What role does innovation play in small-cap tech investing?
Innovation drives growth and competitive advantage. Companies with strong R&D, unique products, or valuable patents often outperform peers. Investors who assess a firm’s innovation pipeline gain insight into its long-term potential.
Thoughtful research and a multi-angle approach help investors uncover hidden value and build resilience in their portfolios.
Unearthing Opportunity: A Deeper Look at Small-Cap Tech for Long-Term Growth
In the ever-evolving pursuit of long-term wealth creation, the small-cap tech space offers a unique blend of challenge and promise—an arena where the overlooked can become tomorrow’s leaders. Navigating this landscape requires more than just sharp numbers; it calls for a deliberate, layered approach that blends valuation metrics with a deep understanding of innovation, management quality, and market positioning. At VASRO, we recognize that true insight often lies beyond the headline figures. Our work in equity analysis and market intelligence emphasizes not only precision but perspective—seeing where others glance, questioning what others accept. With small-cap indices poised for robust earnings growth and the IPO market finding its footing again, the stage is set for those who can thoughtfully interpret the signals amid the noise. It’s not about forecasting the future—it’s about being prepared to recognize value when it quietly presents itself.
Disclaimer: The information provided on www.vasro.de is for general informational purposes only and does not constitute investment advice or a recommendation to invest in any particular asset or market. VASRO GmbH does not offer personalized investment advice, and the content on this website should not be relied upon as such. Visitors are encouraged to seek independent financial advice tailored to their specific circumstances before making any investment decisions. VASRO GmbH disclaims any liability for investment decisions made based on the information presented on this website.