


You step into the world of equity investing with curiosity and ambition, seeking clarity in every stock report and portfolio update. Understanding the equity report glossary empowers you to interpret stock performance, analyze shares, and spot opportunities in your portfolio. Many investors, according to recent research, feel unsure about the definitions of key investment terms, even though they recognize the impact on their investment outcomes. By mastering this glossary, you gain confidence in evaluating shares, earnings, and investment strategies. Use this resource to strengthen your knowledge, make sense of stocks, and approach each investment decision with greater certainty.
Table of Contents
Key Takeaways
Mastering key investment terms like EPS, P/E ratio, and market capitalization helps you understand company performance and stock value.
Using concepts like diversification, asset allocation, and compound interest can reduce risk and grow your portfolio steadily over time.
Knowing how dividends, beta, and liquidity affect your investments lets you make smarter choices and manage risk effectively.
Understanding advanced terms like stock options, vesting schedules, and tax implications empowers you to maximize equity compensation benefits.
Staying informed about new trends such as ESG scores, AI-driven metrics, and digital asset exposure keeps your investment strategy current and competitive.
Equity Report Glossary Basics
Earnings Per Share (EPS)
Earnings Per Share (EPS) stands as one of the most important terms in any equity report glossary. You calculate EPS by dividing net income available to common shareholders by the weighted average number of common shares outstanding during the period. This calculation excludes treasury shares and deducts preferred dividends, aligning with the most widely accepted financial reporting standards. EPS tells you how much profit each share of stock generates, making it a key measure of company performance.
For example, imagine a company with a net income of $100 million and 10 million shares outstanding. The EPS would be $10. If the company issues more shares or earns more profit, the EPS changes, giving you insight into profitability trends. In 2024, Netflix reported an EPS of $20.28, which led to a surge in its stock price. Investors watched this figure closely, as a higher EPS often signals stronger performance and can drive stock valuation upward.
EPS helps you compare stocks across industries and time periods. When you see EPS rising, you may interpret it as a sign of growth. If EPS falls, you might investigate further to understand the reasons. This term remains central to equity analysis and investment decisions.
Price-to-Earnings Ratio (P/E)
The price-to-earnings ratio (P/E) is another foundational term in the equity report glossary. You calculate the P/E ratio by dividing the current stock price by the earnings per share (EPS). This ratio shows how much investors are willing to pay for each dollar of earnings, serving as a standardized valuation metric.
P/E = Stock Price Per Share / Earnings Per Share
Suppose a stock trades at $20 and has an EPS of $1. The P/E ratio is 20. If the EPS rises to $2, the P/E drops to 10, assuming the price stays the same. A high P/E often signals growth expectations, while a low P/E may indicate undervaluation or caution about future prospects. You should compare a stock’s P/E to its historical range and to competitors in the same industry.
Quarter Ending | P/E Ratio |
|---|---|
March 31, 2024 | 27.45 |
June 30, 2024 | 27.87 |
September 30, 2024 | 28.77 |
December 31, 2024 | 27.99 |
The average P/E ratio for S&P 500 companies in 2024 was about 27.97. This figure helps you gauge whether stocks are expensive or cheap compared to historical norms.

You use the P/E ratio to assess equity valuation, but always consider other factors, such as growth rates and industry trends. This term remains essential for every investor seeking to understand stock pricing and market sentiment.
Market Capitalization
Market capitalization, often called “market cap,” measures a company’s total value in the equity market. You determine market capitalization by multiplying the current stock price by the total number of outstanding shares. For instance, if a company has 20 million shares and each share trades at $500, the market capitalization equals $10 billion.
Market capitalization helps you classify companies as large-cap, mid-cap, or small-cap. Large-cap stocks, such as a blue-chip stock, tend to offer stability and lower risk. Small-cap stocks may provide higher growth potential but come with greater volatility. By understanding market capitalization, you can build a diversified investment portfolio that balances risk and reward.
This term gives you a quick way to compare companies and assess their stage of development. Market capitalization remains a core concept in equity analysis and portfolio construction.
Dividends
Dividends represent payments that companies make to shareholders, rewarding you for holding their stocks. You may receive dividends in several forms:
Cash Dividends: Direct cash payments to shareholders, the most common type.
Stock Dividends: Additional shares issued to shareholders, increasing your share count.
Hybrid Dividends: A mix of cash and stock payouts.
Property Dividends: Distribution of non-monetary assets with monetary value.
Companies choose dividend types based on strategy and investor preferences. Cash dividends appear most frequently, providing you with regular income. Stock dividends increase your holdings without changing the overall value. Hybrid and property dividends offer alternative ways to share profits.
Dividends play a vital role in your investment strategy. They can signal financial health and stability, especially for blue-chip stocks. You may use dividends to generate income, reinvest for growth, or evaluate a company’s commitment to shareholders. Understanding dividends helps you make informed decisions about which stocks to include in your portfolio.
Tip: Reinvesting dividends can accelerate your portfolio growth through the power of compounding.
Beta
Beta measures a stock’s volatility compared to the overall market. You calculate beta by performing a regression analysis of the stock’s historical returns against a market benchmark, such as the S&P 500. The process involves gathering price data, calculating returns, and analyzing the relationship between the stock and the market.
Beta = 1: The stock moves in line with the market.
Beta > 1: The stock is more volatile than the market.
Beta < 1: The stock is less volatile than the market.
Beta can be negative or zero, indicating inverse or independent movement.
Beta helps you understand how a security reacts to market changes. If you prefer stability, you may choose stocks with lower beta. If you seek higher returns and accept more risk, you might select stocks with higher beta. Beta remains a key term in equity analysis, guiding your risk management and investment choices.
Liquidity
Liquidity refers to how easily you can buy or sell a security without affecting its price. You measure liquidity using ratios such as the current ratio, quick ratio, and cash ratio.
Current Ratio: Current assets divided by current liabilities.
Quick Ratio: Liquid assets (cash, receivables, marketable securities) divided by current liabilities.
Cash Ratio: Cash and marketable securities divided by current liabilities.
These ratios help you assess a company’s ability to meet short-term obligations. High liquidity means you can trade stocks quickly and at fair prices. Low liquidity may lead to price swings and higher transaction costs.
From 2020 to 2024, liquidity in the U.S. Treasury market improved at month-ends, with higher trading volumes and lower price impacts. Bid-ask spreads narrowed, and quoted depth increased, supporting smoother trading conditions. However, during market turmoil, liquidity deteriorated even as volume spiked, showing that liquidity and volatility interact in complex ways.
Liquidity remains a crucial term in the equity report glossary. You use it to evaluate financial health, creditworthiness, and the ease of executing investment strategies.
Note: Strong liquidity supports market stability and helps you manage risk in your portfolio.
Investing Glossary: Portfolio & Market Terms

Asset Allocation
You shape your investment journey by deciding how to divide your portfolio among different asset classes, such as stocks, bonds, and cash equivalents. Asset allocation stands as a cornerstone of the investing glossary because it determines your overall risk and return. Each asset class brings unique characteristics—stocks offer higher growth but more volatility, while bonds and cash provide stability and income. By balancing these, you align your portfolio with your financial goals, risk tolerance, and time horizon. In 2025, many investors use models like income, balanced, or growth portfolios, often with mutual funds or ETFs, to achieve broad exposure. Vanguard’s fixed income models, for example, help you focus on capital preservation or total return, depending on your needs. Asset allocation remains one of the most important investing terms, as it shapes your long-term outcomes more than picking individual stocks.
Diversification
Diversification means spreading your investments across a variety of securities, industries, and asset classes. This strategy reduces the risk that any single stock or security will harm your portfolio. Modern portfolio theory shows that holding assets with low or negative correlations lowers overall volatility. For example, if technology stocks fall but healthcare stocks rise, your portfolio may stay balanced. You can diversify by including large-cap, mid-cap, and small-cap stocks, as well as international equities, bonds, and real estate through mutual funds or ETFs. Portfolio diversification helps you manage risk and smooth out returns, making it a key part of risk management.
Compound Interest
Compound interest lets your investments grow faster by earning returns on both your original investment and the gains from previous periods. If you invest $10,000 at a 6% annual return, you earn $600 in the first year. In the second year, you earn interest on $10,600, not just the original amount. Over time, this leads to exponential growth. The Rule of 72 helps you estimate how long it takes to double your money—divide 72 by your annual return rate. For example, with a 10% return, your investment doubles in about 7.2 years. The S&P 500 index funds have averaged about 10% annual compound returns over the past 20 years, showing the power of compounding for patient investors.
Capital Gains
When you sell a stock, ETF, or mutual fund for more than you paid, you realize a capital gain. In the United States, tax rates on long-term capital gains in 2025 depend on your income and filing status. For single filers, the 0% rate applies up to $48,350, the 15% rate starts at $48,350, and the 20% rate begins at $533,400. Mutual funds and ETFs often distribute capital gains to shareholders, so understanding these rates helps you plan for taxes and maximize after-tax returns.
Filing Status | 0% Rate Starts | 15% Rate Starts | 20% Rate Starts |
|---|---|---|---|
Single | $0 | $48,350 | $533,400 |
Married Filing Jointly | $0 | $96,700 | $600,050 |
Head of Household | $0 | $64,750 | $566,700 |
Bear Market
A bear market occurs when stock prices fall by 20% or more from recent highs. During these periods, you may feel fear or uncertainty, which can lead to emotional decisions. Many investors experience loss aversion, making losses feel more painful than gains feel rewarding. Recovering from a 50% loss requires a 100% gain, so bear markets can have a lasting impact on your portfolio. Maintaining diversification, using dollar-cost averaging, and avoiding drastic changes help you stay disciplined and protect your long-term investment goals.
Bubble
A bubble forms when stock prices rise far above their fundamental value, often driven by speculation and investor optimism. Notable examples include the tech bubble of 2000 and the mortgage bubble of 2007. Both saw extreme valuations and sharp corrections, with the Nasdaq 100 dropping 83% after the tech bubble burst. Bubbles can develop in stocks, mutual funds, or ETFs, and they often end with significant losses. Recognizing the signs of a bubble—such as soaring price-to-earnings ratios and unrealistic return expectations—helps you avoid excessive risk and maintain a balanced portfolio.
Tip: Staying informed about market cycles and practicing dollar-cost averaging can help you navigate volatility and avoid the pitfalls of bubbles.
Advanced Equity & Compensation Terms
Stock Options
You encounter stock options frequently in the equity report glossary, especially if you work for a public company or invest in technology firms. Stock options give you the right to buy shares at a set price, known as the strike price, after a certain period. Companies use two main types in 2025: Incentive Stock Options (ISOs) and Nonqualified Stock Options (NSOs). ISOs are reserved for employees, while NSOs can go to employees, advisors, or contractors. Both types help companies attract and retain talent, but they differ in tax treatment and eligibility.
Feature | Incentive Stock Options (ISOs) | Nonqualified Stock Options (NSOs) |
|---|---|---|
Eligible Recipients | Employees only | Employees, advisors, contractors, or service providers |
Tax Implications on Grant | No taxable event | No taxable event |
Tax Implications on Exercise | May trigger AMT if spread is significant | Ordinary income recognized on spread value |
Tax Implications on Sale | Long Term Capital Gain if holding periods met | Long Term Capital Gain |
Granting Entity Tax Deduction | Limited, depends on disposition | Deduction equal to compensation recognized by grantee |
Compliance Requirements | Must file Form 3921 for exercises | Report exercises on W-2 or 1099-NEC depending on recipient |
Holding Period for LTCG | >1 year after exercise and >2 years after grant | >1 year |
Value Restrictions | Max $100,000 exercisable per year per grantee | No restrictions |
Stock options can become a powerful tool for building wealth, especially when the company’s equity value rises.
Vesting Schedule
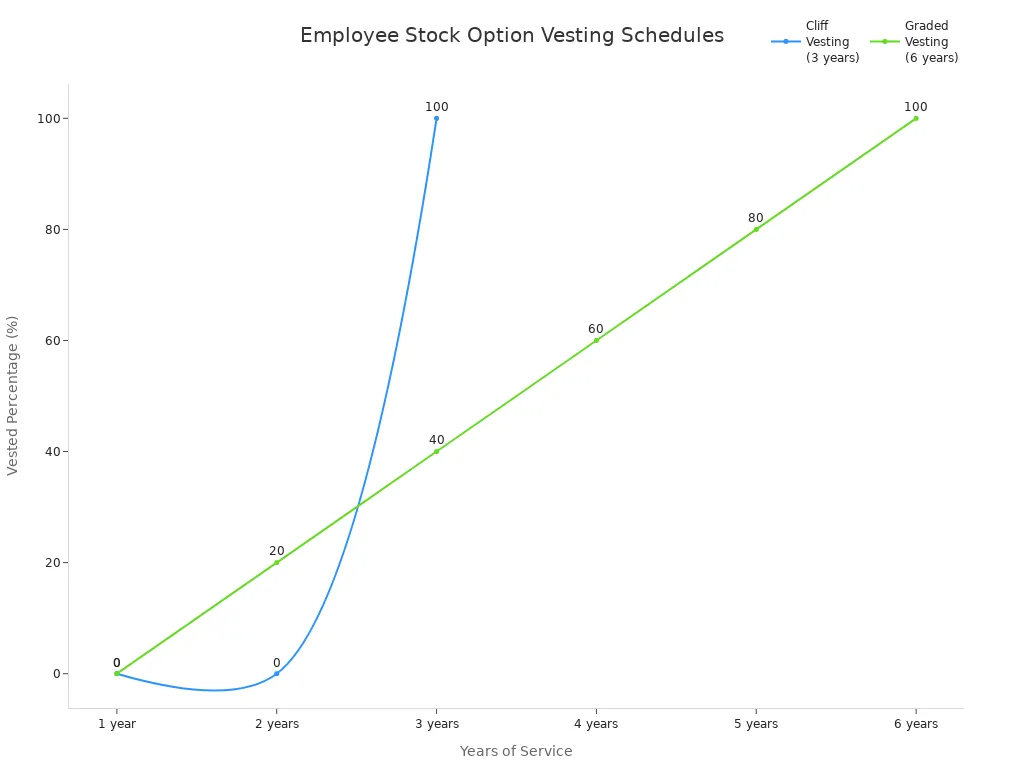
A vesting schedule determines when you gain ownership of your stock options or shares. Most technology companies use a four-year vesting schedule with a one-year cliff. You receive no shares during the first year. After one year, 25% of your shares vest at once. The remaining 75% vest monthly over the next three years. This structure encourages you to stay longer and aligns your interests with the company’s growth. If you leave before full vesting, you forfeit unvested shares. Some companies use cliff, graded, or immediate vesting, each with different timelines and retention incentives.
Years of Service | Cliff Vesting (3 years) | Graded Vesting (6 years) | Immediate Vesting |
|---|---|---|---|
1 | 0% | 0% | 100% |
2 | 0% | 20% | N/A |
3 | 100% | 40% | N/A |
4 | N/A | 60% | N/A |
5 | N/A | 80% | N/A |
6 | N/A | 100% | N/A |
Exercising Shares
When your options vest, you can exercise them by buying shares at the strike price. You must understand the tax implications before exercising. For ISOs, you pay no federal income tax at exercise, but you may trigger the Alternative Minimum Tax (AMT) if the spread between market value and strike price is large. For NSOs, you pay ordinary income tax on the spread at exercise. If you sell shares later, you may owe capital gains tax depending on how long you hold them. Always check your brokerage statements for correct basis reporting.
Tip: Consider exercising shares in a tax-deferred retirement account to manage your tax liability and maximize long-term growth.
Tax Implications
You face several tax considerations when dealing with equity compensation. ISOs offer favorable tax treatment if you meet holding requirements, but AMT can apply. NSOs are taxed as ordinary income at exercise, and later sales may trigger capital gains or losses. Watch for under-withholding and incorrect basis reporting, especially if you exercise many shares or move into a higher tax bracket. Consult a tax professional to avoid surprises and optimize your strategy.
Private Equity
Private equity refers to investments in companies not listed on public stock exchanges. You may access private equity through funds or direct investments. The global private equity market reached $540.72 billion in 2024 and is projected to grow rapidly, especially in North America and the technology sector. Private equity offers opportunities for higher returns and strategic growth, but it often requires longer holding periods and higher risk tolerance. You should review the equity report glossary to understand how private equity differs from public equity and how it fits into your portfolio.
Golden Handcuffs
Golden handcuffs are financial incentives, such as stock options or bonuses, that vest over time. Companies use them to retain top talent in high-growth industries. You benefit from these incentives if you stay with the company, but leaving early means forfeiting unvested shares. Golden handcuffs reduce turnover, attract skilled employees, and align your financial interests with company performance. However, they can also create feelings of being trapped, so companies must balance retention with employee well-being.
Golden handcuffs increase retention by rewarding tenure and performance.
They make recruiting easier and reduce turnover costs.
These incentives promote loyalty and align your goals with the company’s success.
2025 Equity Glossary: Trends & New Metrics
Forward Guidance
You often see forward guidance in modern equity analysis. Companies issue forward guidance to share their expectations for future earnings, revenue, or other financial metrics. This information helps you set realistic expectations and compare your own forecasts with management’s outlook. In 2024, only 23% of S&P 500 companies provided quarterly guidance, which marked a slight drop from previous quarters. However, 61% offered some form of annual guidance, and 55% gave full-year EPS forecasts. Positive guidance appeared more frequently than negative, with 74% of companies issuing optimistic EPS projections.
Metric | Percentage / Count | Notes |
|---|---|---|
Companies providing quarterly guidance (Q4 2024) | 23% | Slightly below prior quarters (28-30%) |
Companies providing any annual guidance (2024) | 61% | In line with 5-year average (~69%) |
Companies providing FY’24 EPS guidance | 55% | Close to 5-year average (~69%) |
Companies issuing negative EPS guidance (Q4 2024) | 24% of those providing guidance | Well below 5- and 10-year averages (58%, 62%) |
Companies issuing positive EPS guidance (Q4 2024) | 74% of those providing guidance |

You rely on forward guidance to anticipate market reactions and adjust your equity positions. This metric remains a vital part of the equity report glossary as you navigate changing market conditions.
ESG Scores
ESG scores—covering Environmental, Social, and Governance factors—have become essential for any investor who wants to understand risk and sustainability. Large asset managers and pension funds now use ESG scores to reduce risk, not just to chase higher returns. Governance quality acts as a baseline for portfolio inclusion, while environmental issues, especially climate change and carbon emissions, receive top priority. Social factors matter less due to measurement challenges. Most investors use ESG scores to exclude the worst performers rather than to eliminate entire industries.
ESG-focused institutional investments may reach $33.9 trillion by 2026, over 20% of assets under management.
Funds following ESG principles already hold more than $18 trillion.
89% of investors consider ESG factors in decisions.
50.1% of investors report lower capital costs for companies with higher ESG scores.
Challenges include incomplete ESG data (46% of investors) and inconsistent ratings (25%).
European investors lead in ESG adoption, while North Americans remain more cautious.
You see ESG scores reflected in equity valuations and risk assessments. Strong ESG performance can lower a company’s cost of capital and improve its reputation.
AI-Driven Metrics
Artificial intelligence now shapes how you analyze equity performance. AI-driven metrics use machine learning to process vast amounts of financial data, news, and alternative signals. These tools help you spot trends, forecast earnings, and identify risks faster than traditional methods. You benefit from AI’s ability to detect patterns in real time, which supports smarter, more adaptive investment strategies. Many equity analysts now rely on AI to enhance their research and gain a competitive edge.
Alternative Data
You find alternative data in sources outside standard financial statements. Examples include satellite imagery, web traffic, credit card transactions, and social media sentiment. This data gives you unique insights into company performance and consumer behavior. Investors use alternative data to supplement traditional equity analysis, often gaining an early view of trends before they appear in official reports. As technology advances, alternative data becomes more accessible and valuable for your decision-making process.
Digital Asset Exposure
Digital asset exposure refers to your portfolio’s involvement with cryptocurrencies, tokenized securities, or blockchain-based assets. In 2025, more companies disclose their digital asset holdings and strategies in equity reports. You monitor digital asset exposure to understand potential risks and opportunities. This metric helps you gauge how innovation and new technologies influence traditional equity markets. As digital assets become mainstream, you see them integrated into broader investment strategies.
10, 5, 3 Rule
The 10, 5, 3 rule offers a simple way to set long-term return expectations. You expect 10% annual returns from stocks, 5% from bonds, and 3% from cash. This rule helps you plan your asset allocation and set realistic goals. While actual returns may vary, the 10, 5, 3 rule provides a useful benchmark for comparing different asset classes. You use this guideline to balance risk and reward as you build your equity portfolio.
Tip: Use these new metrics and trends to stay ahead in a rapidly changing market. Adaptability and continuous learning will help you make informed decisions as an investor.
You strengthen your investment decisions when you master both foundational and emerging terms in this glossary. Understanding the glossary helps you interpret equity reports, market news, and your portfolio’s performance with confidence. You build a deeper perspective on investment trends, risks, and opportunities. As new terms and metrics appear, revisit this glossary and share it with others. Your investment journey grows richer when you stay curious and adapt to change.
FAQ
What is the difference between stocks and shares?
You often see stocks and shares used interchangeably in the equity report glossary. Stocks refer to ownership in a company, while shares represent the individual units of that ownership. When you buy shares, you own a piece of the company’s stock.
How does portfolio diversification help manage risk?
Portfolio diversification spreads your investments across different asset classes, industries, and securities. This approach reduces the impact of any single investment’s poor performance. You create a more resilient portfolio and improve your risk management by including stocks, bonds, mutual funds, and ETFs.
Why do companies pay dividends, and how do they affect your returns?
Companies pay dividends to reward shareholders for their investment. Dividends provide regular income and can signal financial strength. When you reinvest dividends, you benefit from compound growth, which can enhance your long-term returns and support your overall investment strategy.
What does the price-to-earnings ratio tell you about a stock?
The price-to-earnings ratio shows how much you pay for each dollar of a company’s earnings. A high ratio may indicate growth expectations, while a low ratio could suggest undervaluation. You use this metric to compare stocks and make informed decisions in the stock market vocabulary.
How can you use dollar-cost averaging in your investment strategy?
Dollar-cost averaging means you invest a fixed amount regularly, regardless of market conditions. This strategy helps you avoid trying to time the market. Over time, you buy more shares when prices are low and fewer when prices are high, which can lower your average cost per share.
Navigating Wealth with Clarity and Confidence
Wealth creation is less about quick wins and more about building something that endures through changing markets and shifting goals. It begins with clarity—understanding equity reports, spotting lasting trends, and separating signal from noise. At VASRO, we bring insight and precision to market analysis, helping readers interpret data with confidence. From fundamentals like earnings per share to broader concepts such as diversification, ESG scores, and AI-driven metrics, the focus is on knowledge that evolves with you—turning complexity into clarity and long-term growth into a steady, informed journey.
Disclaimer: The information provided on www.vasro.de is for general informational purposes only and does not constitute investment advice or a recommendation to invest in any particular asset or market. VASRO GmbH does not offer personalized investment advice, and the content on this website should not be relied upon as such. Visitors are encouraged to seek independent financial advice tailored to their specific circumstances before making any investment decisions. VASRO GmbH disclaims any liability for investment decisions made based on the information presented on this website. For the data from external sources; VASRO is not liable for accuracy.