

Recent energy market data reveals that renewable energy now leads equity prospects over fossil fuels, driven by robust energy investment and mounting climate change concerns. Investors prioritize financial returns, stability, and sustainability in energy sources. The table below demonstrates a clear energy transition, with clean energy investment nearly doubling fossil fuel spending. Solar energy claims the largest single energy investment globally, reflecting strong market sentiment and confidence in renewables.
Table of Contents
Investment Category | 2025 Projected Investment (USD Trillion) | Five-Year Trend / Notes |
|---|---|---|
Clean Energy (Renewables, Nuclear, Grids, Storage, Efficiency, Electrification) | Investment nearly doubles fossil fuel spending; solar investment nearly doubled; nuclear up 50% | |
Fossil Fuels (Oil, Gas, Coal) | 1.1 | Upstream oil investment declining by 6% (steepest since 2016); coal investment mixed with regional surges |
Solar Energy | 0.45 | Largest single energy investment globally |
Nuclear | >0.07 | Rebounded 50% over five years |
Electricity Investment (Generation, Grids, Storage) | 1.5 | 50% higher than fossil fuel supply spending; driven by rising electricity demand and electrification |
Upstream Oil & Gas | ~0.57 | Total investment down 4%, with 40% for maintenance |

Global energy investment trends, policy shifts, and climate goals now favor renewable energy, shaping the future of the energy market. Businesses and investors recognize the importance of adaptability, innovation, and strategic growth in navigating the ongoing transition.
Key Takeaways
Renewable energy investments now outpace fossil fuels, driven by lower costs, strong policies, and growing market confidence.
Solar and wind power offer the cheapest new electricity options, making clean energy more affordable and reliable than fossil fuels.
Fossil fuel companies still provide steady dividends but face challenges from climate regulations and shifting investor preferences.
Clean energy creates more jobs and supports economic growth, especially in manufacturing and technology sectors.
Government incentives and global climate goals favor renewables, encouraging innovation and long-term market growth.
Energy Market Overview
Investment Flows
The energy market has experienced a dramatic transformation in investment flows from 2020 to 2024. Investors have shifted their focus, with renewable energy and clean energy investment nearly doubling that of fossil fuels. The following table illustrates the evolving landscape of energy investment:
Investment Category | Trend from 2020 to 2024 | Key Figures (2024) |
|---|---|---|
Fossil Fuels | Decreased investment for the first time since 2020, driven by lower prices and expected falling demand | Investment less than half of renewables |
Renewables & Low-Emitting Power | Nearly doubled investment over last five years | $2.2 trillion total investment, double fossil fuels |
Electricity Investments | 50% higher than fossil fuel investments, reversing a decade-old trend | Solar: $450 billion; Battery storage: $65 billion |
Nuclear | Increased by 50% over five years | $75 billion |
Regional Disparities | Africa receives only 2% of total energy investment; China leads globally | China spends twice EU and nearly as much as EU+US combined |
This data highlights a clear pivot in energy investment, as renewable energy and clean energy investment now dominate the global energy market. Investors recognize the long-term potential of renewables, while fossil fuels face declining capital due to shifting demand and price pressures. Electricity investments, particularly in solar and battery storage, have surged, reflecting the growing importance of electrification and grid modernization.
Market Sentiment
Market sentiment in the energy market reveals a complex but decisive trend. Clean energy stocks have outperformed fossil fuel equities in returns during the first half of 2025, signaling robust interest in ESG-aligned investments. However, renewable energy equities still represent a smaller share of institutional portfolios compared to fossil fuels. Many institutional investors continue to favor traditional oil and natural gas companies, drawn by their established market presence and attractive dividend yields.
Advanced analytics show a gradual shift in portfolio construction toward sustainable investments, yet the transition remains incremental. Fossil fuel companies offer dividend yields of 3.3% in the S&P 500 energy sector, compared to 1.3% for the broader index, making them appealing to income-focused investors. Midstream energy companies, responsible for transporting oil and refined products, provide stable volumes and high dividends, though they come with tax complexities.
Renewable energy sources like wind and solar account for less than 25% of U.S. electricity generation and remain underrepresented in major energy indices.
Despite strong growth, renewable energy equities are often classified outside traditional energy sectors, limiting their visibility in mainstream portfolios.
Expert voices in the energy market, such as Rob Haworth, note that fossil fuel demand remains significant in the near term, supporting ongoing investment opportunities.
The energy market stands at a crossroads, with clean energy investment and renewable energy growth reshaping the landscape. Investors and businesses who adapt to these evolving trends position themselves for resilience and innovation in a rapidly changing world.
Equity Trends in Fossil Fuels and Renewables

Fossil Fuels Performance
Fossil fuels continue to play a pivotal role in the global energy market, with equity trends reflecting both resilience and underlying challenges. In 2023 and 2024, major fossil fuel companies such as ExxonMobil generated revenues that surpassed those of leading technology firms. Despite these impressive figures, profit margins remained thin due to high extraction and operational costs. Investors observed that, while revenue soared, future profit growth appeared limited. This sentiment became evident in the price-to-earnings ratios, where ExxonMobil’s valuation lagged behind high-growth innovators like Tesla. Stock prices for fossil fuel companies responded to a mix of geopolitical events and market reactions, including tariff changes, which introduced volatility and tempered enthusiasm.
Canadian oil and gas stocks, however, demonstrated notable strength in 2024. Imperial Oil achieved an 18.62% year-to-date gain, driven by record production levels and consistent dividends. The company’s robust quarterly net income and cash flow, alongside a steady share repurchase program, signaled operational stability and a commitment to shareholder returns. Athabasca Oil also posted a 15.68% gain, focusing on thermal and light oil assets. These examples highlight that, even amid global market volatility and concerns about demand growth, select fossil fuel companies can deliver positive equity valuation trends.
Mergers and acquisitions activity in the fossil fuel sector remains significant. In late 2023, Chevron’s $59.7 billion acquisition of Hess and ExxonMobil’s $68.3 billion purchase of Pioneer Natural Resources underscored the sector’s ongoing appetite for large-scale deals. However, a strategic shift is underway, with companies increasingly pursuing smaller, mid-market acquisitions aimed at replenishing reserves and scaling operations. National oil companies from the Middle East and China are expanding internationally, often diversifying into low-carbon technologies. Financing for these deals is evolving, as traditional lenders step back and alternative sources such as private credit and hedge funds become more prominent.
Despite these strengths, fossil fuels face headwinds. The sector’s stock valuations remain restrained by investor concerns over long-term profitability, regulatory risks, and the global push toward cleaner energy sources. While favorable policies in the U.S. have revitalized traditional energy companies, the broader market recognizes that the era of unchallenged dominance for fossil fuels is drawing to a close.
Renewable Energy Growth
Renewable energy has emerged as a dynamic force in the equity landscape, propelled by innovation, policy support, and shifting investor priorities. From 2019 to 2023, global renewable energy capacity expanded by 52%, with renewables accounting for over 90% of new U.S. capacity additions in 2023. This remarkable growth reflects both technological progress and a broadening commitment to sustainability.
Recent advancements in digital technologies, including artificial intelligence and real-time data monitoring, have made renewable energy systems smarter and more efficient. These innovations reduce downtime and operating costs, enhancing the economic feasibility of distributed solar generation projects. Investments in renewable energy continue to drive research and development in solar, wind, and battery storage technologies. New materials, advanced photovoltaic cells, and offshore wind turbines address challenges such as energy storage and grid integration, supporting a sustainable and equitable transition.
Cost reductions and modularity in solar photovoltaic and onshore wind technologies enable scalable deployment, from rural off-grid systems to utility-scale plants. Portable solar kits and pay-as-you-go home systems expand access to clean energy in underserved communities. Community-owned energy cooperatives, as seen in Denmark, democratize energy ownership and retain financial benefits locally. Mini-grids powered by renewables in rural areas, such as those in Tanzania, reduce reliance on polluting diesel generators and support local development.
Despite these advances, renewable energy equities have faced short-term headwinds. Clean energy stocks underperformed in recent years, with an average annualized three-year return of negative 14.2% and a 46% loss in a leading clean energy ETF over three years. The 2025 U.S. energy policy shift prioritized fossil fuels and nuclear energy, resulting in regulatory rollbacks and reduced subsidies for renewables. Rising interest rates and inflation increased financing costs, particularly for capital-intensive renewable projects, causing some developers to pause or scale back plans. Market valuations for firms such as Tesla, Enphase Energy, and First Solar declined amid this uncertainty.
However, the long-term outlook for renewable energy remains robust. Technological progress, international climate goals, and consumer demand continue to support growth. Europe maintains strong policy support for renewables, creating a global divergence in market sentiment. Mergers and acquisitions activity in the renewable sector reached a record $117 billion globally in 2024, with North America leading and private equity playing a major role. The sector’s rapid expansion, especially in battery energy storage and solar, benefits from government incentives and stabilizing interest rates.
Investors who recognize the transformative potential of renewable technologies position themselves at the forefront of the energy transition. Embracing renewables not only aligns with global sustainability goals but also offers exposure to innovation-driven growth.
The equity trends in fossil fuels and renewable energy reveal a market in transition. While fossil fuels benefit from policy support and strategic dealmaking, renewable energy’s growth is fueled by innovation, expanding capacity, and a vision for a cleaner future. The interplay of market sentiment, policy shifts, and technological advancement will continue to shape the prospects of both energy sources, offering investors a landscape rich with opportunity and challenge.
Financial Performance
Cost Competitiveness
The financial case for renewable energy has grown stronger as cost trends continue to favor clean technologies over traditional sources. Over the past decade, the average levelized cost of electricity (LCOE) for onshore wind and utility-scale solar PV has dropped dramatically, making them the most affordable new sources of electricity worldwide. Onshore wind now delivers power at an average of $0.034 per kilowatt-hour, while utility-scale solar PV follows closely at $0.043. New hydropower projects remain a moderate-cost option at $0.057 per kilowatt-hour. In contrast, new gas combined cycle plants range from $0.045 to $0.115, and new coal plants present the highest costs among major sources, from $0.071 to $0.173 per kilowatt-hour.
Energy Source | Average LCOE (USD/kWh) | Notes |
|---|---|---|
Onshore Wind | 0.034 | Most affordable new electricity source worldwide |
Utility-scale Solar PV | 0.043 | Close second in affordability |
New Hydropower | 0.057 | Moderate cost renewable option |
New Gas Combined Cycle | 0.045 – 0.115 | Cheapest fossil fuel option, unsubsidized |
New Coal Plants | 0.071 – 0.173 | Highest cost among fossil fuels |

More than 90% of newly commissioned renewable projects now deliver electricity at a lower cost than the cheapest new fossil fuel alternatives. Battery storage costs have also plummeted, falling 93% since 2010, which further strengthens the economics of renewables by addressing intermittency. Even when accounting for storage and backup, renewables plus storage remain cost-competitive. Experts increasingly view new fossil fuel projects as uneconomical compared to renewables, signaling a decisive shift in the energy landscape.
Returns & Risks
Investors evaluating returns and risks in the energy sector encounter a complex landscape shaped by dividend yields, volatility, and evolving market dynamics. Renewable energy companies such as Brookfield Renewable Partners, Clearway Energy, and XPLR Infrastructure currently offer dividend yields ranging from 5.6% to over 10%, with expectations for annual dividend growth between 5% and 9%. These companies benefit from stable cash flows secured by long-term power purchase agreements and demonstrate strong growth potential. In comparison, leading fossil fuel companies like ExxonMobil and Phillips 66 maintain steady dividends, supported by robust cash flow and integrated operations, though their yields are not always specified.
Company Type | Company Name | Dividend Yield (%) | Dividend Growth Expectation (%) | Dividend Characteristics and Supporting Factors |
|---|---|---|---|---|
Renewable Energy | Brookfield Renewable Partners | ~5.6% to >10% | 5% to 9% | Stable cash flows from long-term power purchase agreements; strong growth potential |
Renewable Energy | Clearway Energy | ~5.6% to >10% | 5% to 9% | Similar stable cash flows and growth prospects |
Renewable Energy | XPLR Infrastructure | ~5.6% to >10% | 5% to 9% | Stable cash flows and growth potential |
Fossil Fuel | Enbridge | N/A | N/A | High-yield dividend supported by stable cash flow from pipeline operations and regulated rates |
Fossil Fuel | ExxonMobil | N/A | N/A | Protected dividend status due to strong cash flow generation; integrated operations |
Fossil Fuel | Phillips 66 | N/A | N/A | Dividend growth recognized; strong financial profile with investment-grade balance sheet and cash reserves |
Volatility remains a defining feature of energy equities. Fossil fuel equities have experienced high volatility, averaging 27.2% for active funds over the past three years, largely due to commodity price cycles and geopolitical events. Midstream energy equities, which rely on contract-based revenues, show lower volatility at 22.5% and deliver higher returns and better risk-adjusted performance. Renewable energy equities face volatility from the intermittent nature of wind and solar supply, but advances in storage and grid integration are expected to reduce these fluctuations. Once operational, renewable projects are insulated from commodity price swings, which lowers overall cost uncertainty for portfolios with higher renewable shares. Policy incentives for renewables further reduce exposure to volatile fossil fuel prices, creating a more stable investment environment.
Investors who seek resilience and growth in the energy sector increasingly recognize the advantages of renewable energy, both in terms of cost competitiveness and risk management. As the market continues to evolve, those who adapt to these trends will help shape a more sustainable and financially robust future.
Stability & Growth
Long-Term Prospects
The long-term outlook for the energy sector reveals a landscape shaped by innovation, shifting market dynamics, and evolving investor priorities. Over the past decade, renewable equities have consistently outperformed their fossil fuel counterparts, growing at an average annual rate of 5% between 2009 and 2019. Fossil fuel equities, by comparison, achieved only 1.7% annual growth during the same period. This trend signals a decisive shift in market confidence toward clean technologies.
Renewable assets often serve as safe havens or diversifiers, especially during periods of market volatility.
The relationship between fossil fuel and renewable stocks remains complex, with interdependencies that intensify during extreme events or over longer investment horizons.
Oil price fluctuations can influence the attractiveness of renewables, as higher oil prices tend to boost demand for alternative energy sources.
Advanced quantitative research highlights that renewable ETFs and yieldcos, such as Invesco Solar ETF and NextEra Energy Partners, show increasing integration with fossil fuel stocks, particularly during turbulent market conditions. While fossil fuels still hold significant influence, the future appears increasingly shaped by policy support and rising investment in renewables. Investors who seek stability and growth recognize the potential of renewable energy to deliver resilient returns in a rapidly changing world.
Job Creation
Job creation stands as a critical measure of the energy sector’s contribution to economic growth and social stability. Over the past five years, renewable energy has accounted for 56% of all new jobs in the energy sector, outpacing fossil fuels, which contributed 44%. In 2023 alone, the sector added 250,000 new jobs, with more than half in renewables. Solar energy led the way, creating 18,000 new positions, while wind, electric vehicle, and battery manufacturing also experienced robust expansion.
Sector | Share of New Energy Jobs (Past 5 Years) | Specific Job Growth Examples (2023) |
|---|---|---|
Renewable Energy | 56% | 250,000 new jobs; 18,000 in solar; strong growth in wind, EV, battery manufacturing |
Fossil Fuel | 44% | Slower growth; coal mining up 3.4%; 39,000 new gasoline/diesel vehicle jobs (mainly maintenance/repair) |
Clean energy jobs grew by 4.2% in 2023, more than double the overall U.S. job growth rate. The construction sector added nearly 90,000 positions, including 28,000 in clean energy manufacturing and supply chains. Looking ahead, projections indicate that the renewable industry could create nearly 14 million new manufacturing jobs by 2030, more than doubling current employment levels. While the fossil fuel sector continues to adapt by adopting green skills, its job growth outlook remains less defined.
The future of energy employment will likely be shaped by the continued expansion of renewables, offering opportunities across manufacturing, technology, and skilled trades. As the sector evolves, adaptability and a commitment to innovation will remain essential for sustained growth and stability.
Environmental & Regulatory Impact
Emissions & Compliance
Emissions regulations have become a defining factor in the equity performance of energy companies. Fossil fuel firms, especially those with high carbon emissions, face mounting financial and reputational risks as governments and investors demand stricter compliance with climate goals. Private equity giants with significant fossil fuel holdings, such as Blackstone and KKR, now encounter increased scrutiny due to their portfolios’ climate impact. These companies must navigate not only the direct costs of emissions compliance but also the broader consequences of local pollution and community opposition, which can erode market valuations and investor confidence.
Since the Paris Agreement, fossil fuel companies with elevated carbon emissions have seen their required returns on equity rise by as much as 6.56%, leading to substantial reductions in market value. For example, a modest 0.25% increase in required return can reduce a $10 billion firm’s valuation by over $200 million. In contrast, renewable energy and clean energy investment vehicles generally face fewer local equity challenges and benefit from investor preference for low-emissions assets. As emissions regulations tighten, renewables consistently outperform fossil fuels in equity markets.
Compliance costs further widen the gap. While recent regulatory rollbacks in the U.S. temporarily eased permitting and reduced costs for fossil fuel companies, the long-term trend remains clear. Fossil fuel firms continue to grapple with higher and more volatile compliance expenses, driven by stricter greenhouse gas rules and hidden health and environmental costs. Renewables, supported by technological advances and incentives, maintain lower ongoing costs and greater cost certainty.
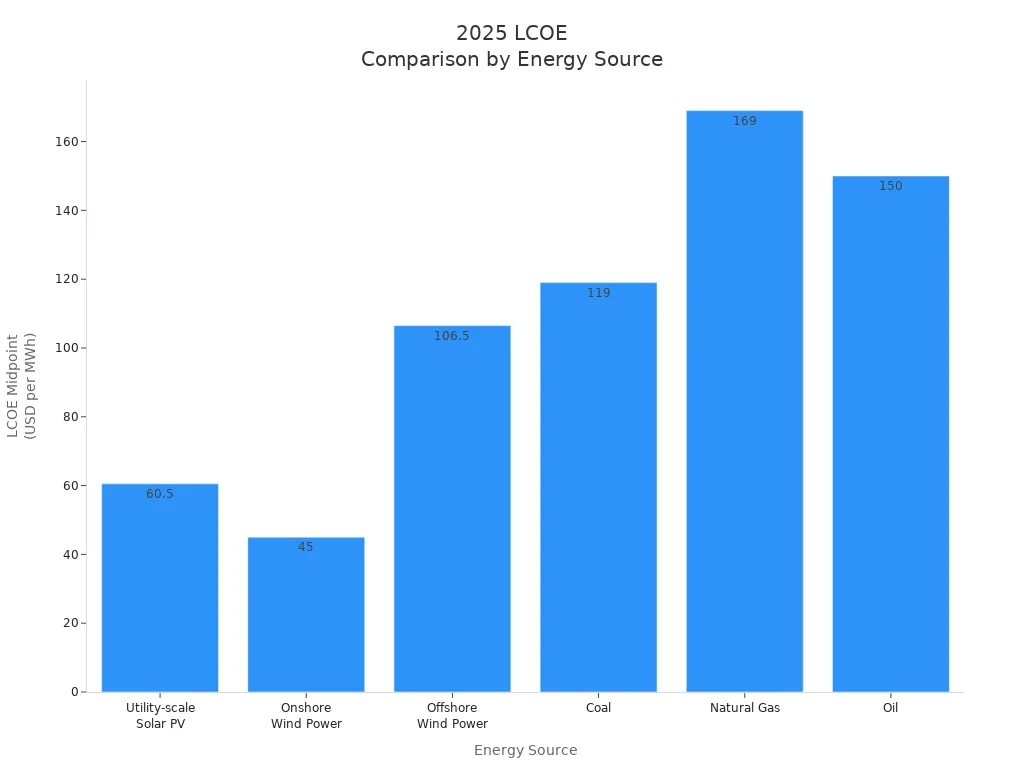
Energy Source | Compliance Cost Trends | |
|---|---|---|
Utility-scale Solar PV | $29 – $92 | Lower ongoing costs; benefits from tech and incentives |
Onshore Wind Power | $27 – $53 | Reduced operating costs; strong tax credit support |
Coal | $69 – $169 | High, volatile costs due to emissions rules and health impacts |
Natural Gas | $110 – $228 | Affected by emissions regulations and market volatility |
Policy Influence
Government incentives and policy shifts play a pivotal role in shaping the energy transition and the equity landscape. In 2025, clean energy investment surged, fueled by a suite of incentives that make clean power more accessible and affordable. The U.S. Federal Solar Tax Credit allows a 30% deduction on solar system costs, while the Energy Efficient Home Improvement Credit offers up to $3,200 annually for upgrades like heat pumps and insulation. States and utilities add rebates, tax exemptions, and net metering, further reducing costs for consumers and businesses.
The U.S. Inflation Reduction Act allocates over $370 billion to clean energy, offering tax credits for solar, wind, battery storage, and electric vehicles.
The European Union guarantees above-market prices for renewable electricity through feed-in tariffs and dedicates significant funding to climate initiatives.
China leads global clean energy manufacturing, using cash subsidies, tax breaks, and grid priority to dominate solar panel and wind turbine production.
These incentives reduce upfront costs, de-risk clean energy investment, and accelerate the sustainable energy transition. Policy shifts in major economies have restored funding for renewables, encouraged private capital, and improved the competitiveness of clean technologies. As a result, clean energy now attracts more favorable equity valuations, while fossil fuels face a constrained future shaped by net-zero emissions targets and net zero pledges.
International climate agreements further reinforce these trends. Investors reward companies and countries that align with climate change commitments, integrating climate risk into equity analysis. The linkage between clean energy markets and the broader energy sector has strengthened since the Paris Agreement, reflecting a decisive market shift toward sustainability and climate responsibility.
The evolving regulatory and policy environment underscores the importance of adaptability and innovation. Companies that prioritize emissions reduction and align with climate goals position themselves for long-term equity growth in a rapidly changing market.
Clean Energy Outlook

Global Expansion
The global clean energy market continues to accelerate, with new records set for capacity additions and investment. BloombergNEF projects the energy storage sector will grow at a compound annual rate of 14.7% through 2035, reaching 220 gigawatts and nearly 1,000 gigawatt-hours. Utility-scale storage projects now span continents, with China leading in both deployment and manufacturing. China surpassed its 1,200 GW solar and wind target six years ahead of schedule and is on track to reach 2,461 GW by 2030. India aims to more than triple its renewable capacity to 509 GW, while the United States, despite recent policy shifts, remains a major player with projections of nearly 938 GW by 2030.
Asia Pacific stands out as the dominant force, with a forecasted CAGR of 17.42% from 2024 to 2033. Latin America, led by Brazil, Chile, Mexico, and Argentina, is set to add 165 GW of renewable capacity between 2023 and 2028. The Middle East and Africa, though starting from a smaller base, now represent the fastest-growing region as countries pivot from hydrocarbons to renewables. The following table highlights key regional growth characteristics:
Region | Growth Characteristics | Key Countries/Drivers |
|---|---|---|
Middle East & Africa | Fastest-growing, shifting from hydrocarbons to renewables | Saudi Arabia, UAE, Egypt, Sub-Saharan Africa |
Asia Pacific | Massive installations, strong government support | China, India, Japan, Australia |
Latin America | Abundant resources, high renewable share | Brazil, Chile, Mexico, Argentina |
North America & Europe | Steady growth, established markets | United States, European Union |

Asia has driven 140% global growth in renewable capacity over the past decade, contributing 72% of new capacity worldwide. Latin America’s progress reflects both abundant resources and growing investor confidence, while the Middle East and Africa are rapidly building new infrastructure. These trends suggest a robust foundation for the future of clean energy, with regional leaders setting ambitious targets and driving innovation.
Challenges Ahead
Despite impressive momentum, the clean energy sector faces significant hurdles that could shape its future trajectory. Renewable projects demand substantial capital and often involve long construction periods and complex technologies. Revenue streams remain vulnerable to natural conditions, which increases financing risks. Geopolitical tensions, regulatory changes, and global events such as the Ukraine-Russia conflict or the COVID-19 pandemic introduce further uncertainty, affecting both project timelines and stock price stability.
Supply chain constraints present another major challenge. Companies encounter operational inefficiencies and production delays due to fragmented data systems and poor coordination. Raw material shortages—especially for silver, lithium, cobalt, and rare earth elements—create bottlenecks that stall development and drive up costs. Transportation bottlenecks and labor shortages add to these pressures, straining budgets and reducing scalability. The solar industry, for example, faces silver scarcity that threatens the sustainability of photovoltaic manufacturing.
Political shifts can also disrupt market confidence. Changes in administration may lead to policy reversals, such as the potential repeal of supportive measures like the Inflation Reduction Act or the introduction of new tariffs on solar panels and steel. These risks contribute to investment uncertainty and market volatility. Additionally, 57% of renewable energy companies cite risk engineering requirements as a major obstacle, while a lack of suitable insurance products and excessive exclusions further complicate project financing.
As the clean energy sector expands, companies that embrace digitalization, real-time data integration, and collaborative supply chain strategies will be better positioned to navigate these challenges. The ability to adapt and innovate will determine which players thrive in the evolving landscape, ensuring that the promise of a sustainable future becomes a reality.
Renewable energy now leads in equity prospects, driven by rapid cost declines, strong sustainability metrics, and robust policy support. Key takeaways include:
Solar and wind deliver lower costs and near-zero emissions, while fossil fuels face price volatility and shrinking market share.
Government incentives and evolving regulations continue to favor clean energy investments.
The 2025 Energy Transition Index shows broad progress in equity and sustainability, though system security remains a concern.
Investors and businesses benefit from monitoring market shifts and policy changes. Active management in renewables and a thoughtful, diversified approach help navigate this evolving landscape, supporting both resilience and long-term growth.
FAQ
What drives equity growth in renewable energy markets?
Innovation, policy support, and declining technology costs fuel equity growth in renewables. Investors see strong potential in solar, wind, and battery storage. Companies that prioritize sustainability and adapt to regulatory changes often outperform traditional energy firms.
How do fossil fuel equities respond to global policy shifts?
Fossil fuel equities react quickly to regulatory changes and geopolitical events. Policy rollbacks may boost short-term returns, but long-term prospects depend on adaptation to climate goals and emissions standards. Strategic diversification helps companies manage risk.
Are renewable energy investments riskier than fossil fuels?
Renewable energy investments face risks from supply chain disruptions and project financing. However, advances in technology and supportive policies reduce volatility. Long-term contracts and stable cash flows make renewables increasingly attractive for equity investors.
What role does job creation play in energy equity analysis?
Job creation signals sector health and growth potential. Renewables lead in new employment opportunities, especially in manufacturing and technology. Companies that invest in workforce development often gain competitive advantages and foster community support.
How can investors stay informed about energy market trends?
Investors monitor market intelligence reports, regulatory updates, and industry news. Engaging with trusted advisors and leveraging data analytics enables informed decision-making. Staying adaptable and proactive ensures resilience in a rapidly evolving energy landscape.
Thoughtful analysis and continuous learning empower investors and businesses to navigate the energy transition with confidence and clarity.
Energy Market Shifts: Insights for Long-Term Growth
Navigating the journey of wealth creation in today’s evolving markets calls for more than just intuition—it requires a grounded sense of perspective, curiosity, and a willingness to adapt as the landscape shifts. At VASRO, we see firsthand how market intelligence and careful equity analysis illuminate long-term trends, especially in sectors like energy, where investment flows have pivoted dramatically toward renewables. Recent data signals a decisive transition, with solar and clean technologies now attracting double the capital of fossil fuels—a shift driven not only by climate imperatives but also by changing investor priorities around financial resilience and sustainability. For those charting a path toward lasting financial success, the real opportunity often lies in staying attuned to such structural changes, combining insight with patience, and embracing a mindset that balances growth with adaptability. At its core, wealth creation is a long game, shaped by the choices we make today in response to tomorrow’s possibilities.
Disclaimer: The information provided on www.vasro.de is for general informational purposes only and does not constitute investment advice or a recommendation to invest in any particular asset or market. VASRO GmbH does not offer personalized investment advice, and the content on this website should not be relied upon as such. Visitors are encouraged to seek independent financial advice tailored to their specific circumstances before making any investment decisions. VASRO GmbH disclaims any liability for investment decisions made based on the information presented on this website. For the data from external sources; VASRO is not liable for accuracy.