


You witness a remarkable shift in the global energy landscape as renewables vs. fossil fuels take center stage. Recent reports show the renewable energy market reached nearly $0.90 trillion in 2022, with projections soaring to $2.06 trillion by 2032.
The share of renewables in global energy commitments has climbed rapidly, with wind projects now leading the way.
This transformation matters because your investment, policy choices, and daily life all feel the impact—financially, environmentally, and through evolving regulations.Table of Contents
Key Takeaways
Renewable energy is rapidly growing, with investments expected to reach $2.06 trillion by 2032, making it a key player in the energy market.
Renewables are now more cost-effective than fossil fuels, with 86% of new renewable capacity cheaper than fossil fuel electricity.
The shift to renewables improves equity in energy access, as seen in rising equity dimension scores, which indicate fairer energy distribution.
Innovations in technology, like battery storage and smart grids, enhance the reliability and efficiency of renewable energy systems.
Government policies and subsidies play a crucial role in shaping the energy landscape, influencing the pace of the transition to cleaner energy sources.
Renewables vs. Fossil Fuels Today
Equity Report Data
You see a clear shift in the energy sector as recent equity reports highlight steady growth in renewables compared to fossil fuels. The latest data shows that countries are making progress in their energy transitions, with improvements in system performance and sustainability. The table below summarizes key year-over-year changes and long-term trends:
Metric | 2025 Change (y-o-y) | 10-Year Average Change (y-o-y) |
|---|---|---|
Overall ETI Scores | +1.1% | +0.4% |
Average System Performance | +1.2% | N/A |
Transition Readiness | +0.8% | +1.2% |
Equity Dimension Scores | +2.2% | N/A |
Sustainability Scores | +1.2% | N/A |
These numbers show that you benefit from a more balanced and sustainable energy system. The rise in equity dimension scores means that access and fairness in energy distribution are improving. Sustainability scores also reflect a growing commitment to clean energy sources.
When you compare renewables vs. fossil fuels, you notice that cost-effectiveness and lifetime energy output have become major factors in decision-making. Over the past decade, solar photovoltaic costs have dropped by 90%, and onshore wind costs have fallen by about 70%. Large-scale solar and wind projects now often deliver electricity at a lower cost than new coal-fired power plants. This shift means that you can expect more affordable and reliable energy from renewable sources.
Renewable energy sources are now more cost-effective than fossil fuels due to advances in technology and supportive policies.
86% of newly installed renewable capacity is cheaper than fossil fuel electricity, representing 187 GW of power.
The reduction in costs for energy generation from renewables in developing countries is projected to exceed $580 billion over their lifetime.
The International Energy Agency predicts that global investment in solar power will surpass oil production for the first time.
Note: Francesco La Camera, Director-General of IRENA, describes 2022 as a turning point for renewables, highlighting their cost-competitiveness even during periods of global inflation.
Global and Regional Trends
You observe that the adoption of renewable energy continues to accelerate worldwide. About one-seventh of the world’s primary energy now comes from renewable technologies. Almost one-third of global electricity is generated from renewable sources. Hydropower remains the largest contributor, but wind and solar power are growing rapidly.
Hydropower leads as the largest source of renewable energy.
Wind and solar power show the fastest growth rates among renewables.
Many regions now rely on renewables for a significant share of their electricity needs.
This global movement toward clean energy reflects a broader commitment to sustainability and innovation. As you look at regional trends, you see that some countries lead in renewable adoption, while others focus on improving access and equity. These shifts create new opportunities for strategic growth and market intelligence in the energy sector.
Energy Sources Defined
Renewable Energy
You encounter renewable energy every day, whether you notice the sun shining, the wind blowing, or water flowing in rivers. These sources offer you clean power and support a sustainable future. The most common types of renewables include:
Definition | |
|---|---|
Solar Energy | The original renewable energy source, utilizing the sun’s heat and light, with types including passive and active solar energy. |
Wind Energy | Harnesses the kinetic energy of wind through turbines, converting it into electricity without emissions. |
Hydro Energy | Derived from moving water, utilizing the kinetic energy of currents to generate electricity. |
Biomass | Organic material that can be converted into usable energy, considered a bio-renewable resource. |
You see solar energy used in homes and businesses, capturing sunlight to generate electricity or heat water. Wind turbines spin in open fields, turning wind into power for your community. Hydropower plants use rivers and dams to supply steady electricity. Biomass, such as wood or agricultural waste, provides another renewable option, turning organic matter into useful energy.
Fossil Fuels
You rely on fossil fuels for much of your daily energy needs, but these sources come from ancient organic material buried underground. The main types include:
Coal: A solid fossil fuel, classified by ash content, moisture, and energy value. You find coal in different forms, such as lignite, bituminous, and anthracite.
Oil (Petroleum): A liquid fossil fuel, valued for its energy content and found in large reservoirs. Oil fields can be supergiant or giant, depending on their size.
Natural Gas: A gaseous fossil fuel, often used for heating and electricity. It ranks as the second most consumed fossil fuel energy source after oil.
Other Solid Fuels: Peat and oil shales, which you can process into usable energy, also belong to this group.
You notice that fossil fuels remain important, but their environmental impact and limited supply push you to consider alternatives.
Current Energy Mix
You live in a world where both renewables and fossil fuels shape the energy mix. In 2023, fossil fuels made up 82% of the global energy supply, while renewables accounted for 15%. This balance shows you the scale of the challenge and the opportunity for innovation. As you follow market intelligence and equity analysis, you see how strategic growth in renewables can shift this mix over time. Your choices, whether as a consumer or policymaker, help drive the transition toward a cleaner and more adaptable energy future.
Financial Impact
Investment Trends
You see a surge in renewable energy investment as global capital flows into clean energy systems. In 2024, global investment in the energy transition reached $2.1 trillion, an 11% increase from the previous year. Investors like you show strong confidence in the sector, even when facing geopolitical challenges. The latest equity reports reveal these trends:
72% of investors accelerate their investments in energy transition assets.
64% invest in energy efficiency technologies.
56% focus on renewable energy.
54% support energy storage.
51% back transport infrastructure.
75% still engage in fossil fuel projects, especially natural gas, to support energy security.
You notice that while renewable energy investment grows, fossil fuels remain part of the mix. This balance highlights the ongoing shift toward clean energy and the need for reliable electricity.
Market Performance
You observe that renewables often provide stability during market volatility. Renewable energy assets act as a safe haven when fossil fuel markets fluctuate. Under normal conditions, renewable ETFs and yieldcos help hedge against swings in fossil fuel prices. However, extreme market events can still impact clean electricity assets. You see that diversification across clean and fossil fuel investments can help manage risk in your portfolio.
Risk and Return
You want to understand how risk and return compare between renewables and fossil fuels. Recent financial analyses show clear differences across regions:
Region | Renewable Portfolio Returns | Fossil Fuel Portfolio Returns | Volatility Comparison |
|---|---|---|---|
United States | Lower returns, higher risk | Higher volatility for fossil fuels | |
United Kingdom | Higher average annual return | Lower average annual return | Half the volatility for renewables |
Germany | Higher returns | Lower returns | Lower volatility for renewables |
France | Higher returns | Lower returns | Lower volatility for renewables |
You see that renewable portfolios often deliver higher returns and lower risk than fossil fuel portfolios. This trend supports the growing appeal of clean investments and highlights the value of innovation and adaptability in the energy sector.
Environmental Impact and Climate

Emissions Comparison
You can see a clear difference in emissions when you compare renewable energy sources to fossil fuels. Renewable systems, once installed, emit little to no ongoing carbon dioxide. Over their entire lifecycle, renewables cut emissions by up to 99% compared to fossil fuels. Fossil fuels, on the other hand, release large amounts of greenhouse gas emissions during extraction, refining, and transportation. The table below highlights the contrast in emissions for each energy source:
Energy Source | Emissions (gCO₂/kWh) |
|---|---|
Wind power | ~11 |
Solar PV | ~40–50 |
Hydropower | ~24 |
Geothermal | ~38 |
Coal | ~1,000 |
Natural Gas | ~450 |
Oil | ~730 |
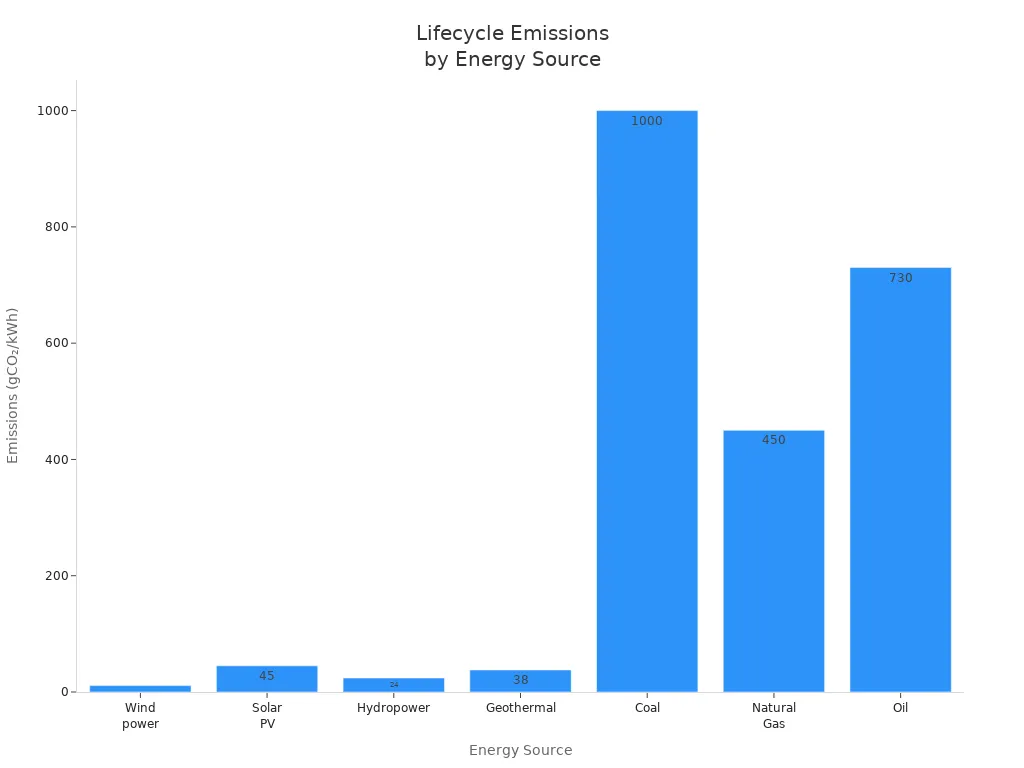
You notice that wind, solar, and hydropower produce far less pollution than coal, oil, or natural gas. This difference matters for your community and the planet.
Climate Change Effects
You play a role in the fight against climate change by supporting clean energy. When you choose renewables, you help reduce carbon emissions and slow global warming. Studies show that fossil fuels drive up greenhouse gas emissions, which leads to rising temperatures and more extreme weather. The table below summarizes key findings:
Evidence Type | Description |
|---|---|
Carbon Emission Reduction | Renewable energy adoption cuts carbon emissions, helping to meet climate goals. |
Global Warming Impact | Fossil fuels increase greenhouse gases, fueling climate change. |
Policy Recommendations | Shifting to clean energy is vital for climate risk reduction and sustainability. |
You see that increasing renewable energy use lowers climate risk and supports a safer future. The urgency of this transition grows as climate pressures mount.
Sustainability
You recognize that sustainability shapes the future of energy. Renewable resources offer lower emissions and support many global development goals. Countries now commit to reducing fossil fuel use to meet these targets. Programs like the Green Climate Fund help developing nations make the switch to clean electricity. The table below compares sustainability metrics:
Aspect | Renewable Energy Resources (RERs) | Fossil Fuels |
|---|---|---|
Environmental Impact | Higher emissions | |
Contribution to SDGs | 80 identified indicators | Limited contribution |
Transition Challenges | Barriers to deployment | Established infrastructure |
You help drive innovation and equity analysis by supporting renewables. Your choices encourage strategic growth and adaptability in the energy sector, paving the way for a cleaner, more sustainable world.
Policy and Regulation
Incentives and Subsidies
You notice that government incentives and subsidies shape the direction of the energy sector. These financial supports influence your choices and the pace of the transition to clean energy. Around the world, governments spend hundreds of billions to over a trillion dollars each year on fossil fuel subsidies. In 2017, fossil fuels received 70% of global energy subsidies, while renewables received only 20%. In the United States, from 2016 to 2022, half of federal energy subsidies supported renewables, with less than 15% going to fossil fuels.
These numbers show a shift in priorities, but fossil fuels still receive significant backing. You see how incentives can either speed up or slow down the adoption of renewable energy.
Governments allocate large sums to fossil fuel subsidies.
Renewables now receive a growing share of support, especially in developed economies.
Shifts in subsidy policies can drive innovation and market intelligence in clean energy.
International Policy
You play a role in a global system where international policies guide the adoption of renewable and clean electricity. These policies set the stage for cooperation and competition among countries. The following table summarizes how international actions influence the energy landscape:
Findings | Implications |
|---|---|
International supply-side coalitions can support climate goals. | They help transition to a renewables-based energy system. |
Combining supply and demand-side measures minimizes GDP impact. | Suggests a balanced approach to policy implementation. |
Policies aimed at reducing GHG emissions promote renewable energy adoption. | This leads to a shift away from fossil fuels. |
Continued subsidies for fossil fuels hinder the transition to renewables. | Indicates inconsistency in climate policy implementation. |
Strict policies can reduce import dependence in developed countries. | |
Higher compliance costs may dampen positive trade effects. | Indicates a potential barrier to renewable energy adoption. |
You see that strong international agreements and climate policies encourage the shift to renewables. However, ongoing support for fossil fuels can slow progress. Policy consistency and cooperation remain essential for meeting global emissions targets.
Barriers and Opportunities
You encounter both challenges and possibilities as you look at the regulatory landscape for renewables. The table below highlights key barriers and opportunities:
Barriers/Opportunities | Description |
|---|---|
Inefficient planning processes hinder the integration of renewable energy sources. | |
Interconnection Costs | High costs associated with connecting renewable projects to the grid can deter investment. |
Capacity Market Rules | Existing rules favor conventional resources, limiting opportunities for renewables. |
Stakeholder Engagement Challenges | Difficulties in engaging local stakeholders can slow down policy reforms. |
Potential Reforms | Reforms in transmission planning and market participation rules can enhance opportunities for hybrid and distributed energy resources. |
You see that regulatory reforms and improved stakeholder engagement can unlock new growth in clean energy. By addressing these barriers, you help create a more adaptable and equitable energy system that supports innovation and sustainability.
Technology and Innovation
Storage and Grid
You see rapid progress in how you store and manage clean energy. Innovations in battery storage now give you more flexibility and resilience in the grid. Smart technology lets you monitor and control storage systems in real time, making your electricity supply more reliable. Virtual power plants coordinate many small energy sources, which helps stabilize the grid. New battery chemistries, such as sodium-ion and lithium-sulfur, promise lower costs and improved safety. Blockchain technology empowers you to trade energy locally, supporting a more decentralized system. As you notice, decentralization drives demand for local storage, and government policies encourage you to adopt these solutions. The electrification of transportation also increases your need for efficient storage, ensuring that renewable generation can meet your daily needs.
Battery storage innovations enhance grid flexibility.
Smart systems allow real-time control.
Virtual power plants improve stability.
New battery types lower costs and boost safety.
Blockchain enables decentralized trading.
Cost and Efficiency
You benefit from remarkable cost and efficiency improvements in renewable energy technologies. Over the past decade, solar energy costs dropped by 89%, and wind energy by 70%. In contrast, electricity from coal fell by only 2%. Coal power plants reach efficiencies of about 33%, with the best at 47%, but these numbers lag behind the rapid gains in solar technology. These improvements mean you can access clean electricity at lower prices, making clean energy more competitive and attractive for your community.
New Developments
You witness a wave of new developments shaping the future of renewable energy. The table below highlights some of the most promising trends and their real-world impact:
Trend | Description | Example | Market Projection |
|---|---|---|---|
Bifacial panels and perovskite cells boost efficiency. | Spain’s Andasol Solar Power Station, 150 MW | Global solar capacity reached 1,200 GW in 2023 | |
Offshore Wind Power Expansion | Floating turbines increase accessibility and output. | Dogger Bank Wind Farm, 3.6 GW | Expected to grow from 60 GW in 2023 to 240 GW by 2030 |
Green Hydrogen Production | Hydrogen from renewables offers a clean fuel alternative. | Saudi Arabia’s NEOM project, 650 tons daily by 2026 | Market projected to reach $89.2B by 2030 |
Energy Storage Innovations | Advanced batteries stabilize the grid. | Tesla’s Megapack, Moss Landing project, 400 MWh | Projected to reach $546B by 2035 |
AI and Machine Learning | Data analysis optimizes energy management. | Google’s AI cuts energy use by 30% | Expected to generate $12B by 2028 |
Smart Grids and IoT Integration | Smart meters and IoT improve distribution and management. | Enel Group’s smart meters in 40M households | Projected to reach $88.7B by 2030 |
Floating Solar Farms | Solar panels on water bodies save land and boost efficiency. | Ramagundam Floating Solar Plant, 100 MW | Market expected to reach $10.2B by 2030 |
Waste-to-Energy Technologies | Innovative processes turn waste into energy. | Sweden converts 50% of household waste into energy | Projected to reach $54B by 2030 |
Carbon Capture and Storage | Capturing CO2 supports renewable integration. | Norway’s Northern Lights project, 1.5M tons CO2 | Projected to reach $35B by 2035 |
Bioenergy Advancements | New methods produce biofuels and biogas from organic materials. | Neste’s renewable diesel from waste | Biofuel production forecasted at 65B gallons by 2030 |
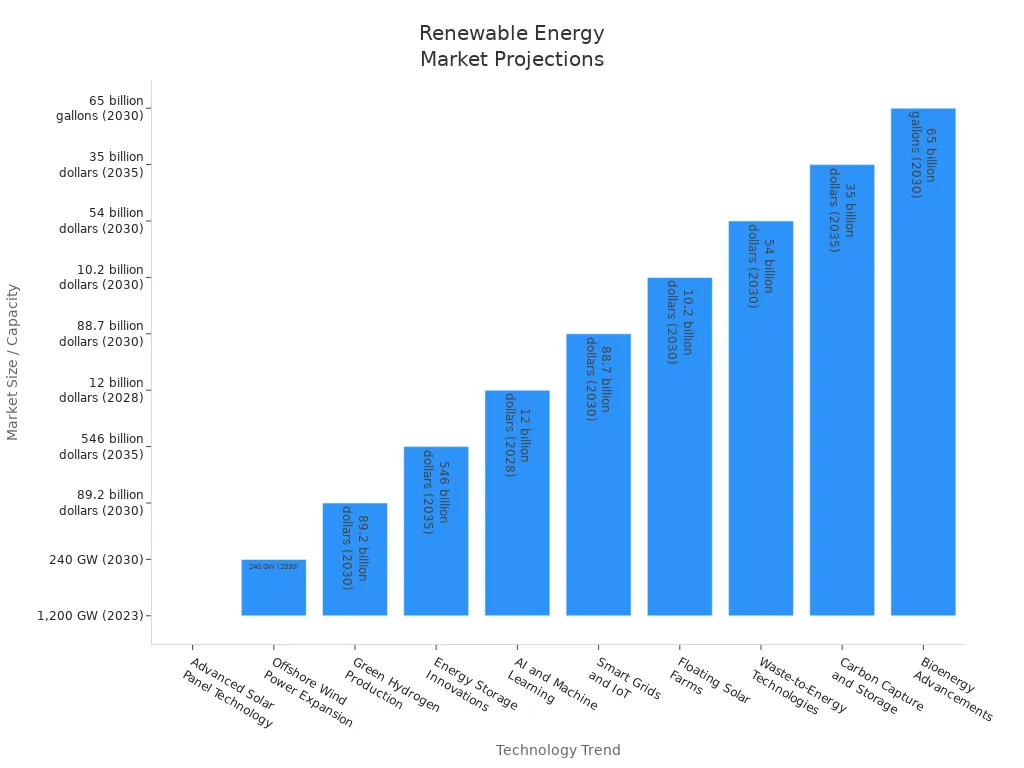
You see that these innovations not only drive strategic growth but also support equity analysis and market intelligence. As you follow these trends, you help shape a future where clean energy is accessible, reliable, and sustainable for everyone.
Misconceptions and Limits
Myths About Renewables
You may hear many myths about renewable energy. Some people believe that renewables cannot replace fossil fuels or that they always reduce fossil fuel use. In reality, the situation is more complex. Here are some common misconceptions:
Some think renewable energy systems create too many greenhouse gases. In fact, coal-fired power plants produce about 20 times more greenhouse gases than wind, solar, or nuclear energy.
Many believe renewables are too unreliable. When you combine different renewable sources, you can achieve a stable energy supply.
There is a belief that renewable energy destroys jobs. The truth is, clean energy supports over three million jobs in the U.S., nearly three times more than fossil fuel jobs.
The environmental impact of renewable energy is much lower than that of fossil fuels. While manufacturing renewable equipment does create some emissions, these are small compared to coal-based electricity.
Equity Report Insights
Recent equity and industry reports emphasize that the renewable energy sector is heavily reliant on subsidies, which raises concerns about its sustainability. The reports also indicate that the transition to renewable sources like wind and solar has contributed to rising electricity costs, contradicting claims that these sources would lower prices. Furthermore, the intermittent nature of these energy sources poses significant challenges for grid integration, leading to potential blackouts.
You see that while renewables offer many benefits, the transition brings real challenges. You must consider both the opportunities and the limits.
Data Limitations
You should know that current equity reports on renewables and fossil fuels have some data gaps:
Wind and solar depend on weather, making it hard to meet constant power needs, especially for data centers.
Many data centers sit in cities where access to renewable energy is limited, so energy must travel from rural areas, causing inefficiencies.
Companies often report emissions based on operational control, not equity, which can misalign with financial data.
Most climate data lacks independent checks, which can lower investor confidence.
Changes in company emissions may come from many factors, so companies need to explain these shifts.
You gain a clearer view of the energy sector when you understand these limits and look for reliable, verified data.
Actionable Insights
For Investors
You can use equity reports to guide your decisions as you navigate the evolving energy sector. These reports help you evaluate companies’ decarbonisation efforts and compare renewable energy with fossil fuels. You gain valuable insights by focusing on metrics such as implied temperature rise, engagement activities, and attribution analysis.
You can track engagement through both quantitative measures, like the number of corporate dialogues, and qualitative feedback, such as comments on proposals.
You see how emissions attribution breaks down the drivers behind changes in portfolio emissions, which promotes transparency and helps you understand the real-world impact of your investments.
You should recognize that historical data may not always predict future performance, so robust frameworks are essential for assessing climate performance.
Note: Engagement activities highlight your intent and relationships with other financial actors addressing climate challenges, but numbers alone may not tell the full story.
For Policymakers
You play a crucial role in accelerating the transition to renewables and clean energy. Recent reports identify ten key barriers to scaling renewable solutions and offer innovative recommendations to overcome them.
You can restructure the energy industry to reduce reliance on fossil fuels, which supports sustainability and economic growth.
You see that government policy direction fosters renewable innovation and helps create a supportive environment for new technologies.
You may consider pollution taxes, which can drive renewable energy innovation and contribute positively to GDP.
Real-world examples show that organizations can successfully navigate these barriers with the right policy tools.
Future Outlook
You stand at a pivotal moment in the global transition. Leading analysts project a significant increase in renewable capacity, especially in solar and wind. Utility-scale solar and wind now account for nearly 90% of new electricity builds in early 2024. The US Energy Information Administration expects wind capacity to reach 153.8 GW and solar to rise to 128.2 GW by the end of 2024. As you look ahead, you see employment in renewables surpassing that in fossil fuels, reflecting the momentum of transitioning from fossil fuels to a cleaner, more sustainable future. You also notice the growing role of electric vehicles and other innovative solutions in shaping the energy landscape.
You see that renewables vs. fossil fuels shape the future of energy with rapid shifts in investment, technology, and policy. The latest equity and industry reports show that you must:
Integrate weather and climate data into planning for renewables vs. fossil fuels.
Build comprehensive datasets and regulatory frameworks to support renewable energy.
Address equity and access challenges, making renewables vs. fossil fuels a strategic focus.
Key Insight | Description |
|---|---|
Tailor strategies to local needs for effective energy transitions. | |
Investment in Clean Energy | Direct significant resources to support sustainable growth. |
Challenges in Equity and Access | Ensure fair access for all, especially vulnerable communities. |
You help drive innovation and equity analysis by supporting informed decisions in this evolving landscape.
FAQ
What drives the shift from fossil fuels to renewables?
You see innovation and market intelligence leading the way. Governments set new policies. Investors seek sustainable growth. Communities want cleaner air. These factors combine to accelerate the transition and create opportunities for strategic growth in the energy sector.
How does renewable energy impact equity and access?
You notice renewable energy projects often improve access for underserved communities. Equity analysis helps you understand who benefits most. When you support clean energy, you help create fairer opportunities and reduce disparities in energy distribution.
What challenges do renewables face in grid integration?
You encounter issues like intermittent supply and high interconnection costs. Grid operators must adapt to new technologies. Strategic planning and innovation help you overcome these barriers, ensuring reliable electricity for everyone.
Why do electricity prices sometimes rise during the energy transition?
You see prices increase when infrastructure upgrades and new technologies require investment. Temporary costs may rise, but long-term benefits include cleaner energy and improved efficiency. Market intelligence helps you track these trends and plan for future changes.
How can you stay informed about energy sector shifts?
You can follow equity reports, industry analyses, and policy updates. Reliable data sources and expert insights help you understand trends. Staying informed empowers you to make decisions that support innovation and adaptability in the energy sector.
Making Sense of Markets with Clarity and Context
Objective equity research plays a vital role in clarifying complex market dynamics by grounding analysis in disciplined data gathering, contextual awareness, and methodological rigor rather than speculation or noise. In an era where the energy sector illustrates profound structural shifts—such as the accelerating balance between renewables and fossil fuels—clear frameworks and transparent approaches help distinguish signal from distraction, making underlying trends more comprehensible. By approaching each dataset with curiosity, precision, and clarity, equity research does more than chart numbers; it reveals the interplay between technology, regulation, and market sentiment. At VASRO, this ethos shapes a measured, insightful voice in equity analysis and market intelligence, offering perspectives that illuminate rather than overwhelm. This article is for general information only and does not constitute financial, investment, legal, or tax advice; readers should consult a licensed professional for advice tailored to their situation.
Disclaimer: The information on www.vasro.de is for general informational purposes only and does not constitute investment advice or a recommendation. VASRO GmbH does not provide personalized investment advice; visitors should seek independent financial guidance before making decisions. Some content may rely on third-party sources considered reliable, but VASRO GmbH does not guarantee accuracy, completeness, or timeliness. All information is provided “as is,” may change without notice, and VASRO GmbH has no obligation to update, correct, or continue publishing it. VASRO GmbH accepts no liability for losses arising from reliance on this information. Past performance is not a reliable indicator of future results.