


You face a complex landscape when you invest in the energy sector, where market intelligence and a disciplined approach to energy equity metrics can make all the difference. By tracking five essential metrics—Operating Leverage, Margin Trends, Share Count Trend, Earnings Quality, and ROIC vs. WACC—you empower yourself to spot trends that matter most for energy stocks and equity performance. These metrics help investors and stakeholders navigate volatility, especially as energy sector companies respond to rising regulatory risks and evolving sustainability expectations. Recent studies show that advanced models using sector-specific energy consumption data provide robust signals for energy stocks, improving your ability to identify strong performers and sidestep potential pitfalls. As you invest in the energy sector, you need reliable metrics to inform your decisions. Market intelligence, grounded in real-world data, gives investors and stakeholders the clarity needed to succeed in a rapidly changing environment.
Table of Contents
Key Takeaways
Track operating leverage to understand how fixed costs affect energy companies’ profits when sales change, helping you spot risks and opportunities.
Monitor margin trends to see how well companies manage costs and maintain profits despite price swings in oil and gas markets.
Watch share count trends closely, since issuing or buying back shares changes your ownership and can signal company strategies.
Evaluate earnings quality to ensure reported profits reflect true company health, reducing surprises and improving investment confidence.
Compare ROIC to WACC to find companies that create real value by earning more than their cost of capital, guiding smarter investments.
Operating Leverage in Energy Equity Metrics

Definition
Operating leverage measures how much a company relies on fixed costs in its operations. In the energy sector, you often see high fixed costs due to investments in infrastructure, drilling equipment, and pipelines. This metric shows how sensitive a company’s profits are to changes in sales volume. When you look at energy companies, especially those in oil and gas, you notice that a small increase in revenue can lead to a much larger jump in profit. For example, if an oil producer has $10,000 in fixed costs and $5,000 in variable costs, generating $100,000 in revenue, a 10% rise in revenue can boost profits by more than 10%. This effect, known as the Operating Leverage Factor, highlights why operating leverage is a key part of energy equity metrics.
Importance
You need to pay close attention to operating leverage when analyzing the energy sector. Oil and gas companies face volatile crude oil prices and natural gas prices, which can swing rapidly due to global events or supply disruptions. High operating leverage means that these price changes have a magnified impact on profits. When crude oil prices rise, companies with high fixed costs can see profits soar. However, if prices fall, losses can mount quickly. Managing this balance is crucial for energy companies, as it affects both profitability and risk. You see this dynamic in companies like Tesla, which spreads high fixed costs over growing sales, a strategy also used by many energy firms.
Tracking
As an investor, you can use several methods to track operating leverage in energy stocks:
Regression analysis helps you understand how changes in oil or natural gas prices affect company profits.
Time series analysis lets you spot trends in revenue and costs over time.
Factor and cluster analysis help you identify patterns in financial data, revealing how different energy companies manage their cost structures.
Tip: Energy management platforms such as Vutility or GridPoint can provide valuable data on operational efficiency, supporting your analysis of cost structures and operating leverage.
You should also monitor industry reports and analytics from sources like Wood Mackenzie to gain deeper insights into the energy sector’s cost dynamics. By tracking operating leverage, you position yourself to better understand how oil and gas companies respond to market shifts and make smarter equity decisions.
Margin Trends in Energy Stocks

Overview
When you analyze energy stocks, margin trends reveal the underlying health of companies across the energy sector. Margins measure how much profit a company keeps from each dollar of revenue after covering costs. In the world of oil and gas, margins can shift quickly due to changes in crude oil prices, natural gas prices, and operational efficiency. Over the past year, you have seen refining margins in the energy sector decline sharply, while exploration and production companies have managed to maintain solid profit margins. Dividend yields in energy stocks remain attractive, with the sector offering a 3.3% yield compared to the S&P 500’s 1.3%. Midstream energy companies, which transport oil and gas, provide even higher yields but experience slower earnings growth. These trends highlight the importance of tracking margin performance as part of your energy equity metrics toolkit.
Metric | Value (USD/bbl or %) | Timeframe |
|---|---|---|
USGC Medium Sour Coking Refining Margin | 10.74 USD/bbl | Q4 2023 (Dec 2023) |
Previous Quarter Margin | 27.65 USD/bbl | Q3 2023 (Sep 2023) |
Quarter-over-Quarter Change | -61.15% | Q4 2023 vs Q3 2023 |
Year-over-Year Margin | 26.02 USD/bbl | Q4 2022 (Dec 2022) |
Year-over-Year Change | -58.72% | Q4 2023 vs Q4 2022 |
Historical High Margin | >40 USD/bbl | Mid-2022 |
Why It Matters
You need to pay close attention to margin trends because they directly impact the profitability and resilience of energy stocks. When oil and gas prices fluctuate, margins can expand or contract rapidly. A company with strong margins can weather downturns in crude oil prices or spikes in natural gas prices more effectively. Margin trends also signal how well a company manages costs and adapts to changing market conditions. For example, a lower price/earnings ratio in the energy sector compared to broader indices suggests that energy stocks may offer better value, especially when margins remain stable. High dividend yields in oil and gas stocks provide income opportunities, even when margin pressures persist. By monitoring these trends, you gain insight into which companies can sustain profitability and deliver long-term value in a volatile market.
Note: Margin trends often reflect broader shifts in the energy sector, such as ongoing demand for fossil fuels and the evolving landscape of oil and gas production.
How to Monitor
You can track margin trends in energy stocks by focusing on several key metrics and analysis techniques:
Review income statements and annual reports to assess revenues, costs, and profitability over time.
Calculate profit margin using the formula: (Net Profit / Revenue) x 100. This helps you gauge cost management and pricing strategies.
Compare profit margins with industry competitors to identify leaders and laggards in the energy sector.
Analyze efficiency ratios, such as accounts receivable turnover and SG&A as a percentage of revenue, to evaluate how well companies manage assets and expenses.
Monitor leverage ratios like EBIT to interest expense and debt-to-equity to understand financial risk and margin sustainability.
Use horizontal and vertical analysis of financial statements to detect margin expansion or contraction.
Incorporate forward-looking projections, considering management guidance, industry trends, and input cost fluctuations.
Continuous monitoring of these metrics enables you to spot margin pressures or improvements early, helping you make informed decisions about energy equity investments. By staying alert to margin trends, you position yourself to navigate the complexities of oil and gas stocks with greater confidence and clarity.
Share Count Trend
What It Is
You often hear about share count trends when analyzing oil and energy stocks, but what does this metric truly represent? Share count trend tracks the changes in the number of outstanding shares a company has over time. In the energy sector, companies may issue new shares to raise capital for large-scale oil exploration or natural gas infrastructure projects. Sometimes, they buy back shares to return value to shareholders. These shifts can signal strategic moves, such as funding renewable energy transitions or responding to regulatory changes. Recent studies use robust classification methods, like the Joint Transparency Reporting approach and ISO 20815 standard, to categorize transactions across fossil fuel and renewable value chains. This ensures you get a precise view of how financing and share structures evolve in oil, natural gas, and renewable energy companies.
Impact on Investors
You need to pay close attention to share count trends because they directly affect your equity in oil and energy stocks. When a company issues more shares, your ownership percentage shrinks, which can dilute earnings per share and reduce the value of your investment. On the other hand, share buybacks can boost earnings per share and signal management’s confidence in the company’s future. Over the past decade, empirical data shows a marked increase in financing for renewable energy, with commitments rising from single digits to over 40% in recent years. This shift often leads to new share issuances as companies pivot from oil and natural gas to cleaner technologies. Understanding these trends helps you anticipate how strategic decisions in the energy sector might impact your returns.
Analysis Methods
You have several powerful tools at your disposal to analyze share count trends in oil and energy stocks:
Volatility modeling, such as DCC-GARCH and GO-GARCH, captures dynamic relationships in stock prices.
Wavelet-based tests reveal how oil and renewable energy stocks move together over time.
Event studies measure how share issuances or buybacks affect stock performance.
Sentiment analysis uses natural language processing to gauge investor mood from news and social media.
Financial ratio analysis, including P/E and ROI, helps you assess valuation and financial health.
Momentum oscillators like RSI and Bollinger Bands identify potential trend reversals.
Peer comparison benchmarks oil and energy stocks against industry competitors.
Tip: Combine these quantitative methods with a close reading of company disclosures to gain a nuanced understanding of share count trends and their implications for your investment strategy.
By tracking share count trends with these metrics, you position yourself to make more informed decisions in a sector shaped by constant change and innovation.
Earnings Quality
Definition
When you evaluate energy companies, you need to understand what earnings quality truly means. High-quality earnings reflect a company’s real economic performance, free from manipulation or distortion. Authoritative sources, such as peer-reviewed journals like Energy Economics, define earnings quality by two main attributes: faithful representation and relevance. Faithful representation ensures that reported earnings accurately capture the company’s financial health, while relevance means the information helps you make sound decisions about the future. In the energy sector, where price volatility and regulatory changes are common, these attributes become even more critical. Leading academic databases, including JSTOR, emphasize the importance of using peer-reviewed research to establish reliable definitions and statistical comparisons, especially in specialized industries like energy.
Significance
You rely on earnings quality to guide your investment decisions in the energy sector. High-quality earnings help you distinguish between companies that manage their operations transparently and those that might obscure risks or inflate results. Empirical research, including a large-scale study of nearly 19,000 firm-year observations, shows that higher earnings quality reduces both overinvestment and underinvestment. This improvement in investment efficiency matters most in markets where governance is weak and earnings manipulation is frequent. The table below summarizes key findings from financial analyses and case studies:
Aspect | Evidence Summary | Implication for Investment Decision-Making |
|---|---|---|
Earnings Quality Impact | Higher earnings quality reduces both overinvestment and underinvestment | Improves investment efficiency and reduces agency conflicts |
Market Context | Frequent earnings manipulation in energy and related sectors | Highlights the need for transparent, high-quality earnings |
Case Examples | Misreporting by companies like Satyam Computers | Demonstrates real risks of poor earnings quality |
You see that high-quality earnings serve as a critical signal, especially in the energy industry, where information asymmetry and agency conflicts can distort capital allocation. Transparent reporting, supported by frameworks like the TCFD, enhances your ability to assess climate-related risks and make informed choices.
Evaluation
You have several advanced techniques at your disposal to assess earnings quality in energy equities. One recommended approach uses a hidden Markov model to measure ‘earnings fidelity’—how closely reported earnings reflect the true economic state of a company. This model analyzes quarterly earnings data and firm characteristics, using Bayesian methods to capture the dynamic nature of the energy business. The technique stands out because it separates accounting quality from the underlying earnings process, providing a more accurate picture than traditional proxies. You can validate this approach by checking its association with future earnings responses and external indicators like restatements. For practical analysis, you should gather at least 20 consecutive quarters of earnings data, focusing on variables such as leverage, size, and cash flow volatility. Robustness tests confirm that this method works well, even for smaller energy firms with limited data.
Tip: By combining rigorous evaluation techniques with a critical eye for transparency, you can better identify which energy companies offer sustainable value and which may pose hidden risks.
Reflecting on these insights, you realize that tracking earnings quality not only sharpens your understanding of company performance but also strengthens your overall approach to energy equity analysis. As the sector evolves, your commitment to high-quality metrics will help you adapt and thrive in a changing market.
ROIC vs. WACC Metrics
ROIC Explained
You need to understand Return on Invested Capital (ROIC) if you want to evaluate how well an energy company turns its capital into profits. ROIC measures the efficiency of a company’s investments and shows how much value management creates for every dollar invested. In the energy sector, you often see companies like NextEra Energy, Inc. using ROIC to guide their capital allocation decisions. Consider these key points:
ROIC is calculated by dividing net operating profit after taxes by total invested capital.
Companies with strong ROIC often invest in projects that generate stable cash flows, such as wind, solar, and battery storage.
Long-term power purchase agreements (PPAs) help reduce revenue volatility, supporting higher ROIC.
Strategic alignment with clean energy trends can further improve ROIC, reflecting both investor preferences and regulatory shifts.
Capital-intensive industries like utilities usually show moderate ROIC, so you should always compare ROIC within the same sector for meaningful insights.
When you track ROIC, you gain a clearer picture of how well an energy company manages its resources and positions itself for sustainable returns.
WACC Overview
Weighted Average Cost of Capital (WACC) represents the average rate a company pays to finance its assets through equity and debt. In the energy industry, WACC varies across different sectors, reflecting differences in risk, capital structure, and market conditions. The following table summarizes recent WACC statistics for several energy segments:
Industry Sector | Number of Firms | Cost of Equity | Debt-to-Equity Ratio | Cost of Debt | After-tax Cost of Debt | WACC |
|---|---|---|---|---|---|---|
Coal & Related Energy | 16 | 9.70% | 91.35% | 5.78% | 4.34% | 9.23% |
Green & Renewable Energy | 18 | 9.47% | 36.21% | 6.41% | 4.81% | 6.50% |
Power | 48 | 6.93% | 55.45% | 5.08% | 3.81% | 5.54% |
Utility (General) | 14 | 6.28% | 56.16% | 5.08% | 3.81% | 5.20% |
Utility (Water) | 15 | 7.52% | 63.04% | 5.08% | 3.81% | 6.15% |
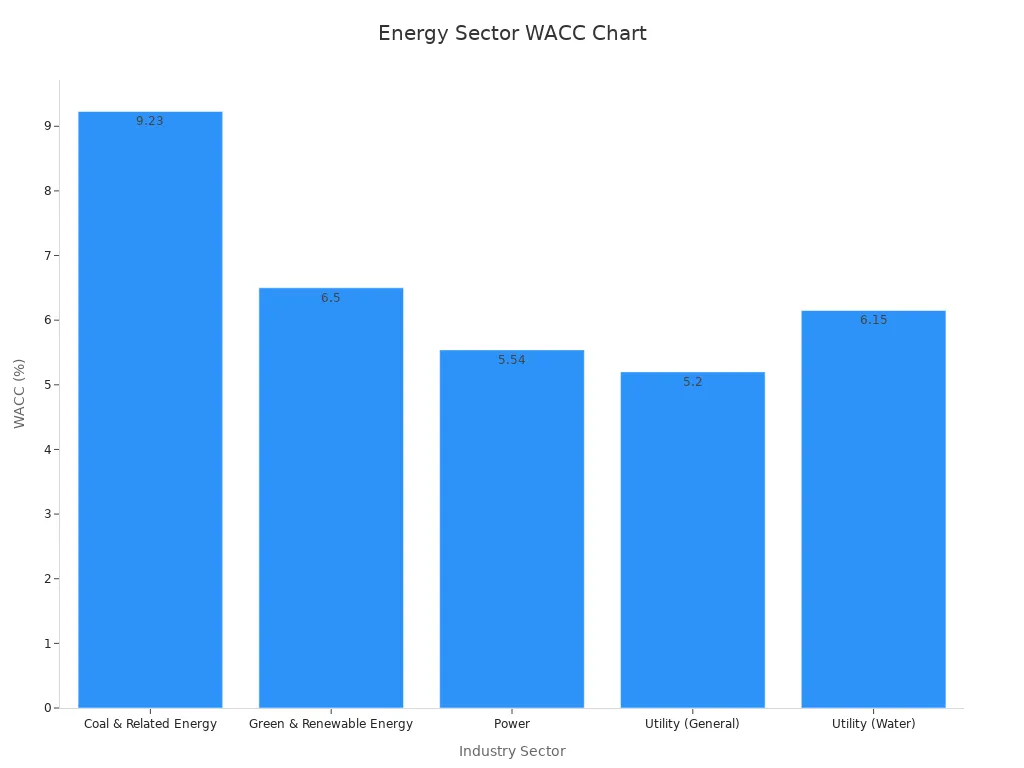
You can find these comprehensive statistics, updated as of January 2025, on Aswath Damodaran’s NYU Stern platform, which remains a trusted source for industry-specific WACC data.
Interpreting the Comparison
When you compare ROIC to WACC, you unlock one of the most powerful metrics for assessing value creation in the energy sector. If a company’s ROIC consistently exceeds its WACC, you know it generates returns above its cost of capital, signaling efficient management and strong potential for long-term growth. If ROIC falls below WACC, the company may struggle to create value, which can erode equity and limit future returns. You should always benchmark these figures within the same industry, as capital intensity and risk profiles differ widely across energy segments. By tracking the relationship between ROIC and WACC, you gain sharper market intelligence and can identify which companies are best positioned to deliver sustainable returns in a rapidly evolving landscape.
Tip: Use the ROIC vs. WACC comparison as a cornerstone of your energy equity analysis. This approach helps you focus on companies that not only grow but also create real value for shareholders.
Market Intelligence and Energy Metrics
Combining Metrics
When you analyze energy stocks, relying on a single metric rarely gives you the full picture. By combining operating leverage, margin trends, share count trend, earnings quality, and ROIC vs. WACC, you create a powerful toolkit for understanding the energy sector. Each metric highlights a different aspect of company performance—cost structure, profitability, capital allocation, transparency, and value creation. When you bring these together, you gain a multi-dimensional view that helps you see beyond surface-level numbers.
You capture both qualitative and quantitative insights, blending financial data with strategic context.
Competitive intelligence and expert interviews add depth, revealing how companies respond to regulatory shifts and technological change.
Strategic market analysis uncovers patterns in consumer behavior and competitor strategies, helping you benchmark performance.
This approach supports risk mitigation, identifies growth opportunities, and guides innovation in the energy market.
Integrating diverse data sources allows you and other stakeholders to navigate volatility and complexity with greater confidence.
Note: Combining multiple research methodologies addresses challenges such as data complexity and market uncertainty, providing you with actionable market intelligence for smarter investment decisions.
Holistic Analysis
A holistic approach to energy metrics transforms how you invest and how stakeholders evaluate opportunities. For example, research on integrated energy systems in remote communities shows that using a flexible, probabilistic modeling framework—one that accounts for uncertainties and risk preferences—leads to more resilient investment decisions. By evaluating trade-offs among energy security, affordability, and sustainability, you can better understand the impact of each decision on the broader transition landscape.
Integrated planning at the precinct scale, which considers both supply and demand-side measures, demonstrates how holistic analysis supports strategic capital investments and retrofit projects. This method not only enhances resource sustainability but also reduces costs, making it easier for investors and stakeholders to align with long-term goals. As you track the transition in the energy sector, a holistic, multi-metric approach helps you uncover emerging trends, benchmark against competitors, and identify unique strengths for sustainable growth.
Reflect on how combining these metrics empowers you to make informed decisions, adapt to change, and contribute to a more innovative and resilient energy future.
You now have a robust framework for evaluating energy equities by tracking operating leverage, margin trends, share count trend, earnings quality, and ROIC vs. WACC. Integrating these metrics captures sector-specific nuances and strengthens your investment considerations:
Studies show that combining diverse metrics, including sustainability and connectivity data, leads to more efficient energy portfolios and better risk management.
Data Envelopment Analysis highlights how nuclear, natural gas, and oil ETFs dominate efficient portfolios when multiple indicators are used.
As you move forward, consider setting up a tracking system—such as a tailored spreadsheet—to monitor these metrics. Engage with stakeholders and adapt your approach to reflect the evolving landscape of energy. This holistic mindset will help you make smarter decisions and stay ahead in a dynamic market.
FAQ
What makes energy equity metrics important for investors?
You gain a clearer view of company performance when you track these metrics. They help you spot trends, compare companies, and make better decisions. By focusing on the right data, you reduce risk and improve your investment considerations in a changing market.
How do changes in crude oil prices and natural gas prices affect energy stocks?
You see energy stocks react quickly to shifts in crude oil prices and natural gas prices. Rising prices often boost profits for energy companies, while falling prices can lower returns. Monitoring these changes helps you understand potential risks and opportunities.
Why should you pay attention to share count trends in the energy sector?
You protect your equity by watching share count trends. When companies issue new shares, your ownership percentage drops. Share buybacks can increase your share of profits. Understanding these moves helps you evaluate the impact on your returns and overall investment strategy.
How does earnings quality influence your investment decisions?
You rely on earnings quality to judge if a company reports its true financial health. High-quality earnings mean fewer surprises and more trust in reported results. This transparency supports better decisions and helps you avoid companies that might hide risks.
What role do stakeholders play in the transition to an equitable energy system?
You see stakeholders shape the transition by supporting policies, investments, and innovations that promote energy justice. Their involvement ensures the electricity system becomes more fair and accessible. This collective effort drives progress toward a more sustainable and inclusive future.
Disclaimer: The information provided on www.vasro.de is for general informational purposes only and does not constitute investment advice or a recommendation to invest in any particular asset or market. VASRO GmbH does not offer personalized investment advice, and the content on this website should not be relied upon as such. Visitors are encouraged to seek independent financial advice tailored to their specific circumstances before making any investment decisions. VASRO GmbH disclaims any liability for investment decisions made based on the information presented on this website.